Korean vs Barbadian Male Unemployment
COMPARE
Korean
Barbadian
Male Unemployment
Male Unemployment Comparison
Koreans
Barbadians
5.3%
MALE UNEMPLOYMENT
34.9/ 100
METRIC RATING
185th/ 347
METRIC RANK
6.9%
MALE UNEMPLOYMENT
0.0/ 100
METRIC RATING
309th/ 347
METRIC RANK
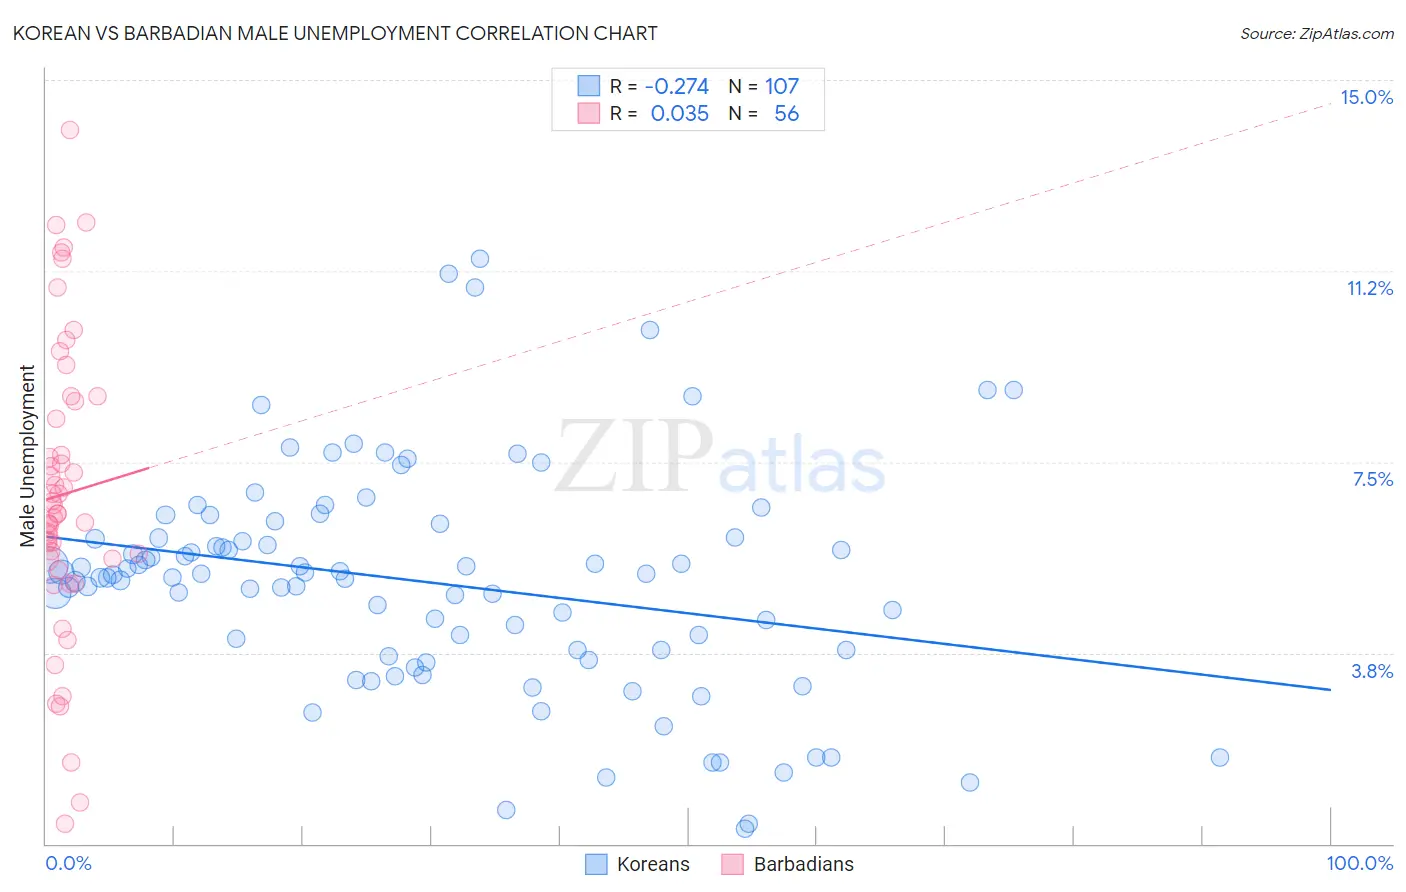
Korean vs Barbadian Male Unemployment Correlation Chart
The statistical analysis conducted on geographies consisting of 506,883,728 people shows a weak negative correlation between the proportion of Koreans and unemployment rate among males in the United States with a correlation coefficient (R) of -0.274 and weighted average of 5.3%. Similarly, the statistical analysis conducted on geographies consisting of 141,188,365 people shows no correlation between the proportion of Barbadians and unemployment rate among males in the United States with a correlation coefficient (R) of 0.035 and weighted average of 6.9%, a difference of 28.3%.
Male Unemployment Correlation Summary
| Measurement | Korean | Barbadian |
| Minimum | 0.30% | 0.40% |
| Maximum | 11.5% | 14.0% |
| Range | 11.2% | 13.6% |
| Mean | 5.1% | 6.9% |
| Median | 5.3% | 6.5% |
| Interquartile 25% (IQ1) | 3.8% | 5.6% |
| Interquartile 75% (IQ3) | 6.0% | 8.5% |
| Interquartile Range (IQR) | 2.2% | 2.9% |
| Standard Deviation (Sample) | 2.2% | 2.8% |
| Standard Deviation (Population) | 2.2% | 2.8% |
Similar Demographics by Male Unemployment
Demographics Similar to Koreans by Male Unemployment
In terms of male unemployment, the demographic groups most similar to Koreans are Spaniard (5.3%, a difference of 0.010%), Taiwanese (5.3%, a difference of 0.17%), Potawatomi (5.3%, a difference of 0.18%), Immigrants from Afghanistan (5.3%, a difference of 0.19%), and Iraqi (5.4%, a difference of 0.22%).
| Demographics | Rating | Rank | Male Unemployment |
| Osage | 42.5 /100 | #178 | Average 5.3% |
| Immigrants | Oceania | 40.8 /100 | #179 | Average 5.3% |
| Malaysians | 39.6 /100 | #180 | Fair 5.3% |
| Immigrants | Afghanistan | 37.9 /100 | #181 | Fair 5.3% |
| Potawatomi | 37.8 /100 | #182 | Fair 5.3% |
| Taiwanese | 37.6 /100 | #183 | Fair 5.3% |
| Spaniards | 35.1 /100 | #184 | Fair 5.3% |
| Koreans | 34.9 /100 | #185 | Fair 5.3% |
| Iraqis | 31.6 /100 | #186 | Fair 5.4% |
| Costa Ricans | 31.3 /100 | #187 | Fair 5.4% |
| Arabs | 30.2 /100 | #188 | Fair 5.4% |
| Immigrants | South America | 29.4 /100 | #189 | Fair 5.4% |
| Immigrants | Uganda | 28.8 /100 | #190 | Fair 5.4% |
| Immigrants | South Eastern Asia | 28.2 /100 | #191 | Fair 5.4% |
| Immigrants | Belarus | 26.0 /100 | #192 | Fair 5.4% |
Demographics Similar to Barbadians by Male Unemployment
In terms of male unemployment, the demographic groups most similar to Barbadians are Aleut (6.8%, a difference of 0.41%), Black/African American (6.9%, a difference of 0.64%), Immigrants from Armenia (6.9%, a difference of 0.96%), Lumbee (6.9%, a difference of 1.2%), and Immigrants from Dominica (7.0%, a difference of 2.2%).
| Demographics | Rating | Rank | Male Unemployment |
| Ute | 0.0 /100 | #302 | Tragic 6.6% |
| Immigrants | West Indies | 0.0 /100 | #303 | Tragic 6.7% |
| West Indians | 0.0 /100 | #304 | Tragic 6.7% |
| Trinidadians and Tobagonians | 0.0 /100 | #305 | Tragic 6.7% |
| Immigrants | Trinidad and Tobago | 0.0 /100 | #306 | Tragic 6.7% |
| Immigrants | Jamaica | 0.0 /100 | #307 | Tragic 6.7% |
| Aleuts | 0.0 /100 | #308 | Tragic 6.8% |
| Barbadians | 0.0 /100 | #309 | Tragic 6.9% |
| Blacks/African Americans | 0.0 /100 | #310 | Tragic 6.9% |
| Immigrants | Armenia | 0.0 /100 | #311 | Tragic 6.9% |
| Lumbee | 0.0 /100 | #312 | Tragic 6.9% |
| Immigrants | Dominica | 0.0 /100 | #313 | Tragic 7.0% |
| Immigrants | Barbados | 0.0 /100 | #314 | Tragic 7.1% |
| Houma | 0.0 /100 | #315 | Tragic 7.1% |
| Immigrants | Guyana | 0.0 /100 | #316 | Tragic 7.1% |