Korean vs Apache Female Poverty Among 18-24 Year Olds
COMPARE
Korean
Apache
Female Poverty Among 18-24 Year Olds
Female Poverty Among 18-24 Year Olds Comparison
Koreans
Apache
16.9%
FEMALE POVERTY AMONG 18-24 YEAR OLDS
100.0/ 100
METRIC RATING
10th/ 347
METRIC RANK
26.3%
FEMALE POVERTY AMONG 18-24 YEAR OLDS
0.0/ 100
METRIC RATING
333rd/ 347
METRIC RANK
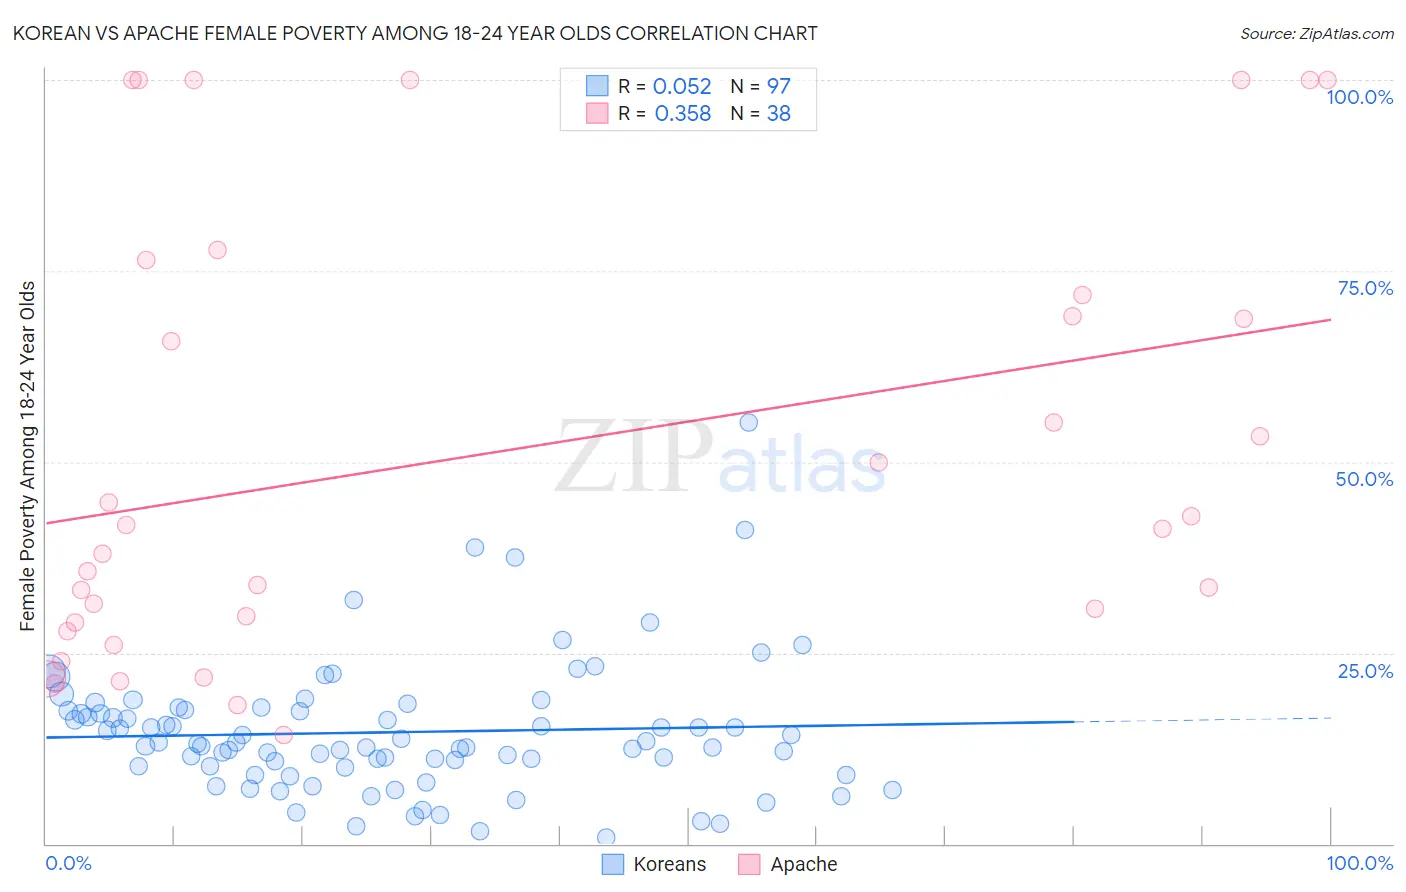
Korean vs Apache Female Poverty Among 18-24 Year Olds Correlation Chart
The statistical analysis conducted on geographies consisting of 491,558,412 people shows a slight positive correlation between the proportion of Koreans and poverty level among females between the ages 18 and 24 in the United States with a correlation coefficient (R) of 0.052 and weighted average of 16.9%. Similarly, the statistical analysis conducted on geographies consisting of 228,623,137 people shows a mild positive correlation between the proportion of Apache and poverty level among females between the ages 18 and 24 in the United States with a correlation coefficient (R) of 0.358 and weighted average of 26.3%, a difference of 55.5%.
Female Poverty Among 18-24 Year Olds Correlation Summary
| Measurement | Korean | Apache |
| Minimum | 0.85% | 14.3% |
| Maximum | 55.1% | 100.0% |
| Range | 54.3% | 85.7% |
| Mean | 14.6% | 51.3% |
| Median | 13.1% | 41.5% |
| Interquartile 25% (IQ1) | 10.1% | 28.9% |
| Interquartile 75% (IQ3) | 17.5% | 71.9% |
| Interquartile Range (IQR) | 7.4% | 42.9% |
| Standard Deviation (Sample) | 8.6% | 28.8% |
| Standard Deviation (Population) | 8.6% | 28.4% |
Similar Demographics by Female Poverty Among 18-24 Year Olds
Demographics Similar to Koreans by Female Poverty Among 18-24 Year Olds
In terms of female poverty among 18-24 year olds, the demographic groups most similar to Koreans are Thai (17.0%, a difference of 0.27%), Immigrants from Peru (16.9%, a difference of 0.36%), Immigrants from Pakistan (17.0%, a difference of 0.36%), Immigrants from Poland (17.1%, a difference of 1.0%), and Immigrants from Bolivia (16.7%, a difference of 1.2%).
| Demographics | Rating | Rank | Female Poverty Among 18-24 Year Olds |
| Immigrants | Cuba | 100.0 /100 | #3 | Exceptional 16.4% |
| Immigrants | India | 100.0 /100 | #4 | Exceptional 16.4% |
| Immigrants | Portugal | 100.0 /100 | #5 | Exceptional 16.5% |
| Immigrants | Philippines | 100.0 /100 | #6 | Exceptional 16.7% |
| Immigrants | Azores | 100.0 /100 | #7 | Exceptional 16.7% |
| Immigrants | Bolivia | 100.0 /100 | #8 | Exceptional 16.7% |
| Immigrants | Peru | 100.0 /100 | #9 | Exceptional 16.9% |
| Koreans | 100.0 /100 | #10 | Exceptional 16.9% |
| Thais | 100.0 /100 | #11 | Exceptional 17.0% |
| Immigrants | Pakistan | 100.0 /100 | #12 | Exceptional 17.0% |
| Immigrants | Poland | 100.0 /100 | #13 | Exceptional 17.1% |
| Tongans | 100.0 /100 | #14 | Exceptional 17.1% |
| Cubans | 100.0 /100 | #15 | Exceptional 17.2% |
| Peruvians | 100.0 /100 | #16 | Exceptional 17.2% |
| Immigrants | Taiwan | 100.0 /100 | #17 | Exceptional 17.3% |
Demographics Similar to Apache by Female Poverty Among 18-24 Year Olds
In terms of female poverty among 18-24 year olds, the demographic groups most similar to Apache are Houma (26.2%, a difference of 0.53%), Chippewa (25.9%, a difference of 1.6%), Pueblo (26.9%, a difference of 2.2%), Immigrants from Somalia (25.7%, a difference of 2.2%), and Cajun (25.7%, a difference of 2.5%).
| Demographics | Rating | Rank | Female Poverty Among 18-24 Year Olds |
| Yakama | 0.0 /100 | #326 | Tragic 25.3% |
| Ute | 0.0 /100 | #327 | Tragic 25.4% |
| Natives/Alaskans | 0.0 /100 | #328 | Tragic 25.4% |
| Cajuns | 0.0 /100 | #329 | Tragic 25.7% |
| Immigrants | Somalia | 0.0 /100 | #330 | Tragic 25.7% |
| Chippewa | 0.0 /100 | #331 | Tragic 25.9% |
| Houma | 0.0 /100 | #332 | Tragic 26.2% |
| Apache | 0.0 /100 | #333 | Tragic 26.3% |
| Pueblo | 0.0 /100 | #334 | Tragic 26.9% |
| Yup'ik | 0.0 /100 | #335 | Tragic 27.0% |
| Immigrants | Yemen | 0.0 /100 | #336 | Tragic 27.5% |
| Cheyenne | 0.0 /100 | #337 | Tragic 28.1% |
| Hopi | 0.0 /100 | #338 | Tragic 28.2% |
| Pima | 0.0 /100 | #339 | Tragic 28.4% |
| Sioux | 0.0 /100 | #340 | Tragic 28.6% |