Macedonian vs Apache Female Poverty Among 18-24 Year Olds
COMPARE
Macedonian
Apache
Female Poverty Among 18-24 Year Olds
Female Poverty Among 18-24 Year Olds Comparison
Macedonians
Apache
18.1%
FEMALE POVERTY AMONG 18-24 YEAR OLDS
100.0/ 100
METRIC RATING
43rd/ 347
METRIC RANK
26.3%
FEMALE POVERTY AMONG 18-24 YEAR OLDS
0.0/ 100
METRIC RATING
333rd/ 347
METRIC RANK
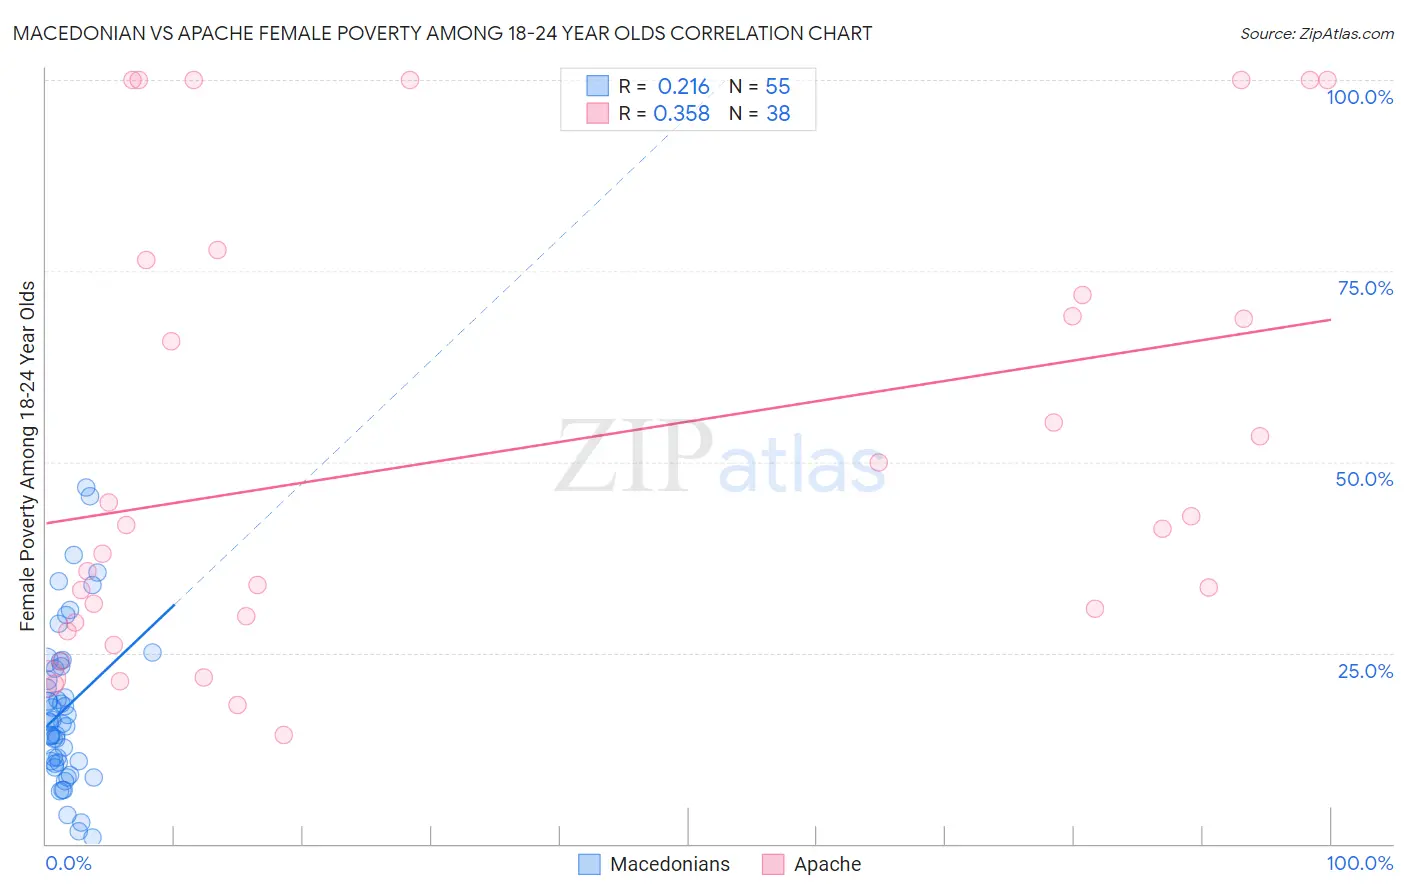
Macedonian vs Apache Female Poverty Among 18-24 Year Olds Correlation Chart
The statistical analysis conducted on geographies consisting of 130,973,657 people shows a weak positive correlation between the proportion of Macedonians and poverty level among females between the ages 18 and 24 in the United States with a correlation coefficient (R) of 0.216 and weighted average of 18.1%. Similarly, the statistical analysis conducted on geographies consisting of 228,623,137 people shows a mild positive correlation between the proportion of Apache and poverty level among females between the ages 18 and 24 in the United States with a correlation coefficient (R) of 0.358 and weighted average of 26.3%, a difference of 45.6%.
Female Poverty Among 18-24 Year Olds Correlation Summary
| Measurement | Macedonian | Apache |
| Minimum | 0.76% | 14.3% |
| Maximum | 46.6% | 100.0% |
| Range | 45.9% | 85.7% |
| Mean | 17.6% | 51.3% |
| Median | 15.8% | 41.5% |
| Interquartile 25% (IQ1) | 10.6% | 28.9% |
| Interquartile 75% (IQ3) | 23.3% | 71.9% |
| Interquartile Range (IQR) | 12.7% | 42.9% |
| Standard Deviation (Sample) | 10.2% | 28.8% |
| Standard Deviation (Population) | 10.1% | 28.4% |
Similar Demographics by Female Poverty Among 18-24 Year Olds
Demographics Similar to Macedonians by Female Poverty Among 18-24 Year Olds
In terms of female poverty among 18-24 year olds, the demographic groups most similar to Macedonians are Bulgarian (18.1%, a difference of 0.010%), Nicaraguan (18.1%, a difference of 0.080%), Spanish American Indian (18.1%, a difference of 0.17%), Immigrants from Southern Europe (18.2%, a difference of 0.45%), and Immigrants from Argentina (18.0%, a difference of 0.48%).
| Demographics | Rating | Rank | Female Poverty Among 18-24 Year Olds |
| Immigrants | South America | 100.0 /100 | #36 | Exceptional 17.9% |
| Immigrants | Croatia | 100.0 /100 | #37 | Exceptional 17.9% |
| South Americans | 100.0 /100 | #38 | Exceptional 18.0% |
| Puget Sound Salish | 100.0 /100 | #39 | Exceptional 18.0% |
| Immigrants | Romania | 100.0 /100 | #40 | Exceptional 18.0% |
| Immigrants | Argentina | 100.0 /100 | #41 | Exceptional 18.0% |
| Bulgarians | 100.0 /100 | #42 | Exceptional 18.1% |
| Macedonians | 100.0 /100 | #43 | Exceptional 18.1% |
| Nicaraguans | 100.0 /100 | #44 | Exceptional 18.1% |
| Spanish American Indians | 100.0 /100 | #45 | Exceptional 18.1% |
| Immigrants | Southern Europe | 100.0 /100 | #46 | Exceptional 18.2% |
| Asians | 100.0 /100 | #47 | Exceptional 18.2% |
| Sri Lankans | 100.0 /100 | #48 | Exceptional 18.2% |
| Bhutanese | 100.0 /100 | #49 | Exceptional 18.2% |
| Samoans | 100.0 /100 | #50 | Exceptional 18.2% |
Demographics Similar to Apache by Female Poverty Among 18-24 Year Olds
In terms of female poverty among 18-24 year olds, the demographic groups most similar to Apache are Houma (26.2%, a difference of 0.53%), Chippewa (25.9%, a difference of 1.6%), Pueblo (26.9%, a difference of 2.2%), Immigrants from Somalia (25.7%, a difference of 2.2%), and Cajun (25.7%, a difference of 2.5%).
| Demographics | Rating | Rank | Female Poverty Among 18-24 Year Olds |
| Yakama | 0.0 /100 | #326 | Tragic 25.3% |
| Ute | 0.0 /100 | #327 | Tragic 25.4% |
| Natives/Alaskans | 0.0 /100 | #328 | Tragic 25.4% |
| Cajuns | 0.0 /100 | #329 | Tragic 25.7% |
| Immigrants | Somalia | 0.0 /100 | #330 | Tragic 25.7% |
| Chippewa | 0.0 /100 | #331 | Tragic 25.9% |
| Houma | 0.0 /100 | #332 | Tragic 26.2% |
| Apache | 0.0 /100 | #333 | Tragic 26.3% |
| Pueblo | 0.0 /100 | #334 | Tragic 26.9% |
| Yup'ik | 0.0 /100 | #335 | Tragic 27.0% |
| Immigrants | Yemen | 0.0 /100 | #336 | Tragic 27.5% |
| Cheyenne | 0.0 /100 | #337 | Tragic 28.1% |
| Hopi | 0.0 /100 | #338 | Tragic 28.2% |
| Pima | 0.0 /100 | #339 | Tragic 28.4% |
| Sioux | 0.0 /100 | #340 | Tragic 28.6% |