Cypriot vs Apache Female Poverty Among 18-24 Year Olds
COMPARE
Cypriot
Apache
Female Poverty Among 18-24 Year Olds
Female Poverty Among 18-24 Year Olds Comparison
Cypriots
Apache
19.3%
FEMALE POVERTY AMONG 18-24 YEAR OLDS
95.5/ 100
METRIC RATING
119th/ 347
METRIC RANK
26.3%
FEMALE POVERTY AMONG 18-24 YEAR OLDS
0.0/ 100
METRIC RATING
333rd/ 347
METRIC RANK
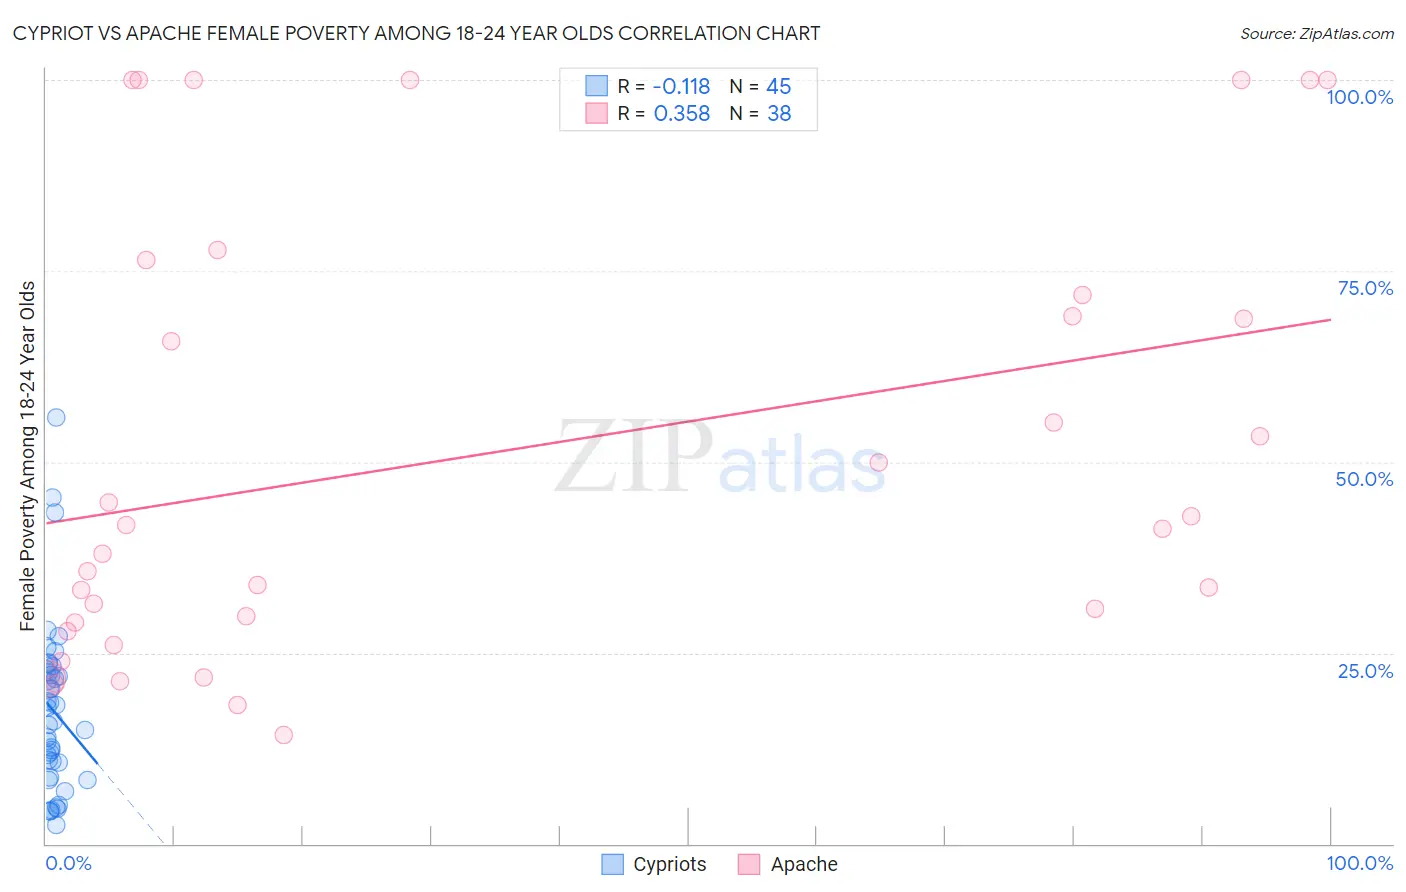
Cypriot vs Apache Female Poverty Among 18-24 Year Olds Correlation Chart
The statistical analysis conducted on geographies consisting of 61,185,624 people shows a poor negative correlation between the proportion of Cypriots and poverty level among females between the ages 18 and 24 in the United States with a correlation coefficient (R) of -0.118 and weighted average of 19.3%. Similarly, the statistical analysis conducted on geographies consisting of 228,623,137 people shows a mild positive correlation between the proportion of Apache and poverty level among females between the ages 18 and 24 in the United States with a correlation coefficient (R) of 0.358 and weighted average of 26.3%, a difference of 36.0%.
Female Poverty Among 18-24 Year Olds Correlation Summary
| Measurement | Cypriot | Apache |
| Minimum | 2.5% | 14.3% |
| Maximum | 55.9% | 100.0% |
| Range | 53.4% | 85.7% |
| Mean | 17.4% | 51.3% |
| Median | 16.0% | 41.5% |
| Interquartile 25% (IQ1) | 9.7% | 28.9% |
| Interquartile 75% (IQ3) | 22.6% | 71.9% |
| Interquartile Range (IQR) | 12.9% | 42.9% |
| Standard Deviation (Sample) | 11.1% | 28.8% |
| Standard Deviation (Population) | 10.9% | 28.4% |
Similar Demographics by Female Poverty Among 18-24 Year Olds
Demographics Similar to Cypriots by Female Poverty Among 18-24 Year Olds
In terms of female poverty among 18-24 year olds, the demographic groups most similar to Cypriots are Immigrants from Guyana (19.3%, a difference of 0.020%), Immigrants from Northern Europe (19.4%, a difference of 0.040%), Immigrants from Iran (19.3%, a difference of 0.070%), Guyanese (19.4%, a difference of 0.070%), and Immigrants (19.3%, a difference of 0.11%).
| Demographics | Rating | Rank | Female Poverty Among 18-24 Year Olds |
| Immigrants | El Salvador | 96.5 /100 | #112 | Exceptional 19.3% |
| Immigrants | Cameroon | 96.3 /100 | #113 | Exceptional 19.3% |
| Slovenes | 96.2 /100 | #114 | Exceptional 19.3% |
| Immigrants | Hungary | 96.2 /100 | #115 | Exceptional 19.3% |
| Immigrants | Immigrants | 95.9 /100 | #116 | Exceptional 19.3% |
| Immigrants | Iran | 95.8 /100 | #117 | Exceptional 19.3% |
| Immigrants | Guyana | 95.6 /100 | #118 | Exceptional 19.3% |
| Cypriots | 95.5 /100 | #119 | Exceptional 19.3% |
| Immigrants | Northern Europe | 95.4 /100 | #120 | Exceptional 19.4% |
| Guyanese | 95.3 /100 | #121 | Exceptional 19.4% |
| Cambodians | 94.6 /100 | #122 | Exceptional 19.4% |
| Paraguayans | 94.6 /100 | #123 | Exceptional 19.4% |
| Immigrants | Chile | 94.3 /100 | #124 | Exceptional 19.4% |
| Immigrants | Panama | 94.0 /100 | #125 | Exceptional 19.4% |
| Immigrants | Russia | 93.7 /100 | #126 | Exceptional 19.4% |
Demographics Similar to Apache by Female Poverty Among 18-24 Year Olds
In terms of female poverty among 18-24 year olds, the demographic groups most similar to Apache are Houma (26.2%, a difference of 0.53%), Chippewa (25.9%, a difference of 1.6%), Pueblo (26.9%, a difference of 2.2%), Immigrants from Somalia (25.7%, a difference of 2.2%), and Cajun (25.7%, a difference of 2.5%).
| Demographics | Rating | Rank | Female Poverty Among 18-24 Year Olds |
| Yakama | 0.0 /100 | #326 | Tragic 25.3% |
| Ute | 0.0 /100 | #327 | Tragic 25.4% |
| Natives/Alaskans | 0.0 /100 | #328 | Tragic 25.4% |
| Cajuns | 0.0 /100 | #329 | Tragic 25.7% |
| Immigrants | Somalia | 0.0 /100 | #330 | Tragic 25.7% |
| Chippewa | 0.0 /100 | #331 | Tragic 25.9% |
| Houma | 0.0 /100 | #332 | Tragic 26.2% |
| Apache | 0.0 /100 | #333 | Tragic 26.3% |
| Pueblo | 0.0 /100 | #334 | Tragic 26.9% |
| Yup'ik | 0.0 /100 | #335 | Tragic 27.0% |
| Immigrants | Yemen | 0.0 /100 | #336 | Tragic 27.5% |
| Cheyenne | 0.0 /100 | #337 | Tragic 28.1% |
| Hopi | 0.0 /100 | #338 | Tragic 28.2% |
| Pima | 0.0 /100 | #339 | Tragic 28.4% |
| Sioux | 0.0 /100 | #340 | Tragic 28.6% |