Korean vs Apache In Labor Force | Age > 16
COMPARE
Korean
Apache
In Labor Force | Age > 16
In Labor Force | Age > 16 Comparison
Koreans
Apache
65.7%
IN LABOR FORCE | AGE > 16
95.3/ 100
METRIC RATING
126th/ 347
METRIC RANK
60.7%
IN LABOR FORCE | AGE > 16
0.0/ 100
METRIC RATING
334th/ 347
METRIC RANK
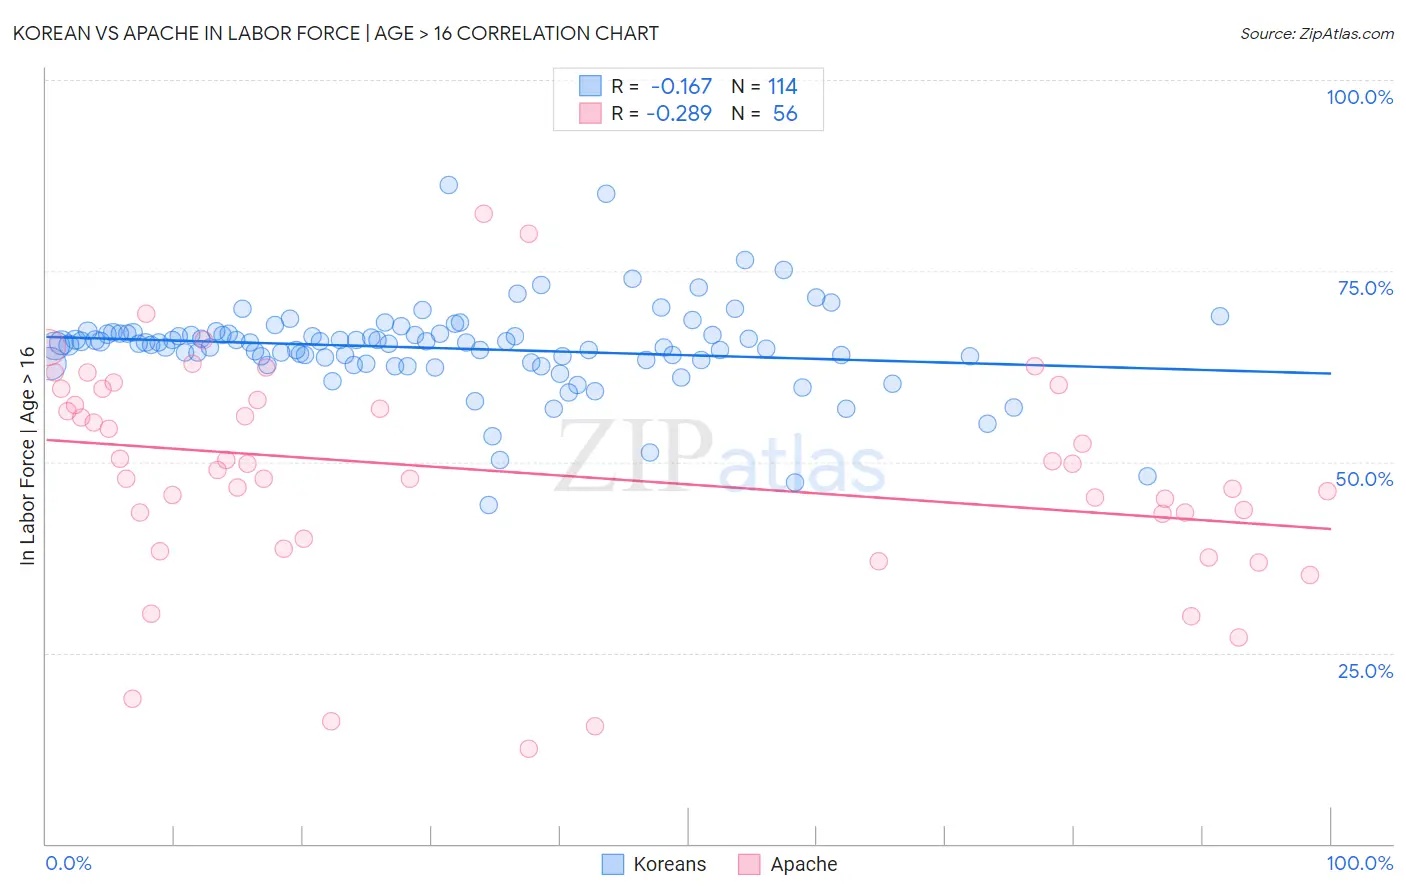
Korean vs Apache In Labor Force | Age > 16 Correlation Chart
The statistical analysis conducted on geographies consisting of 510,971,555 people shows a poor negative correlation between the proportion of Koreans and labor force participation rate among population ages 16 and over in the United States with a correlation coefficient (R) of -0.167 and weighted average of 65.7%. Similarly, the statistical analysis conducted on geographies consisting of 231,124,853 people shows a weak negative correlation between the proportion of Apache and labor force participation rate among population ages 16 and over in the United States with a correlation coefficient (R) of -0.289 and weighted average of 60.7%, a difference of 8.2%.
In Labor Force | Age > 16 Correlation Summary
| Measurement | Korean | Apache |
| Minimum | 44.3% | 12.5% |
| Maximum | 86.3% | 82.5% |
| Range | 42.0% | 70.0% |
| Mean | 64.9% | 48.6% |
| Median | 65.6% | 49.3% |
| Interquartile 25% (IQ1) | 63.3% | 41.6% |
| Interquartile 75% (IQ3) | 66.8% | 58.8% |
| Interquartile Range (IQR) | 3.5% | 17.2% |
| Standard Deviation (Sample) | 5.8% | 14.5% |
| Standard Deviation (Population) | 5.8% | 14.4% |
Similar Demographics by In Labor Force | Age > 16
Demographics Similar to Koreans by In Labor Force | Age > 16
In terms of in labor force | age > 16, the demographic groups most similar to Koreans are Norwegian (65.7%, a difference of 0.0%), Immigrants from Iraq (65.7%, a difference of 0.010%), Iraqi (65.7%, a difference of 0.010%), Immigrants from Eastern Asia (65.7%, a difference of 0.020%), and Ecuadorian (65.6%, a difference of 0.030%).
| Demographics | Rating | Rank | In Labor Force | Age > 16 |
| Immigrants | France | 96.4 /100 | #119 | Exceptional 65.7% |
| Immigrants | Hong Kong | 96.2 /100 | #120 | Exceptional 65.7% |
| New Zealanders | 96.0 /100 | #121 | Exceptional 65.7% |
| Immigrants | Ecuador | 95.9 /100 | #122 | Exceptional 65.7% |
| Immigrants | Iraq | 95.5 /100 | #123 | Exceptional 65.7% |
| Iraqis | 95.4 /100 | #124 | Exceptional 65.7% |
| Norwegians | 95.3 /100 | #125 | Exceptional 65.7% |
| Koreans | 95.3 /100 | #126 | Exceptional 65.7% |
| Immigrants | Eastern Asia | 94.9 /100 | #127 | Exceptional 65.7% |
| Ecuadorians | 94.7 /100 | #128 | Exceptional 65.6% |
| Immigrants | Philippines | 94.5 /100 | #129 | Exceptional 65.6% |
| Immigrants | Guatemala | 94.4 /100 | #130 | Exceptional 65.6% |
| Icelanders | 94.3 /100 | #131 | Exceptional 65.6% |
| Immigrants | North Macedonia | 94.1 /100 | #132 | Exceptional 65.6% |
| Immigrants | Lithuania | 93.5 /100 | #133 | Exceptional 65.6% |
Demographics Similar to Apache by In Labor Force | Age > 16
In terms of in labor force | age > 16, the demographic groups most similar to Apache are Paiute (60.7%, a difference of 0.050%), Crow (60.8%, a difference of 0.13%), Native/Alaskan (60.6%, a difference of 0.19%), Menominee (60.6%, a difference of 0.21%), and Ute (60.9%, a difference of 0.30%).
| Demographics | Rating | Rank | In Labor Force | Age > 16 |
| Cajuns | 0.0 /100 | #327 | Tragic 61.8% |
| Dutch West Indians | 0.0 /100 | #328 | Tragic 61.7% |
| Choctaw | 0.0 /100 | #329 | Tragic 61.5% |
| Creek | 0.0 /100 | #330 | Tragic 61.3% |
| Ute | 0.0 /100 | #331 | Tragic 60.9% |
| Crow | 0.0 /100 | #332 | Tragic 60.8% |
| Paiute | 0.0 /100 | #333 | Tragic 60.7% |
| Apache | 0.0 /100 | #334 | Tragic 60.7% |
| Natives/Alaskans | 0.0 /100 | #335 | Tragic 60.6% |
| Menominee | 0.0 /100 | #336 | Tragic 60.6% |
| Colville | 0.0 /100 | #337 | Tragic 59.8% |
| Immigrants | Yemen | 0.0 /100 | #338 | Tragic 59.6% |
| Houma | 0.0 /100 | #339 | Tragic 59.5% |
| Pueblo | 0.0 /100 | #340 | Tragic 59.3% |
| Hopi | 0.0 /100 | #341 | Tragic 58.4% |