Korean vs Apache Householder Income Over 65 years
COMPARE
Korean
Apache
Householder Income Over 65 years
Householder Income Over 65 years Comparison
Koreans
Apache
$67,472
HOUSEHOLDER INCOME OVER 65 YEARS
99.9/ 100
METRIC RATING
41st/ 347
METRIC RANK
$54,668
HOUSEHOLDER INCOME OVER 65 YEARS
0.1/ 100
METRIC RATING
264th/ 347
METRIC RANK
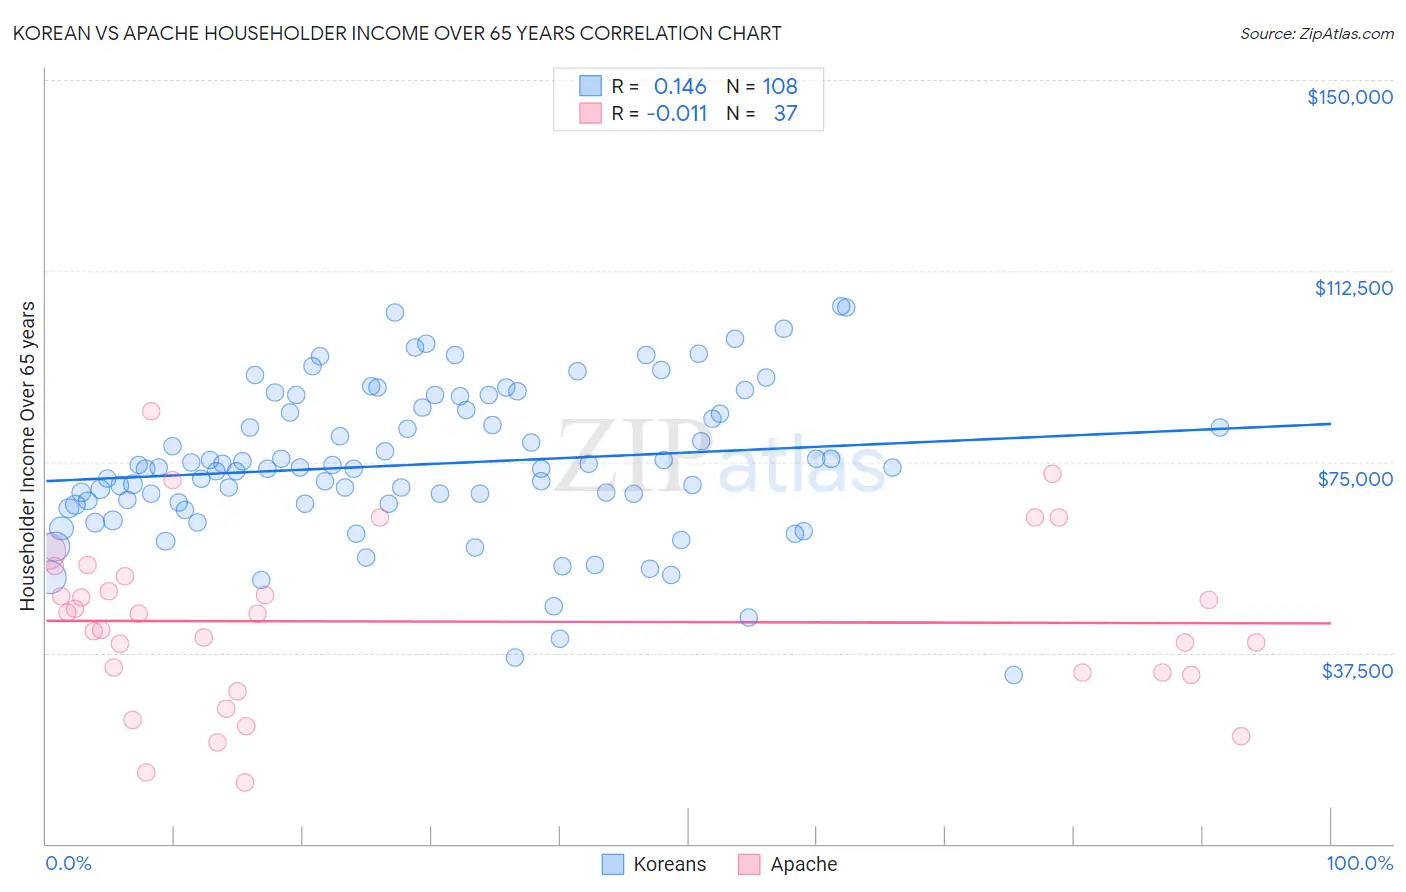
Korean vs Apache Householder Income Over 65 years Correlation Chart
The statistical analysis conducted on geographies consisting of 507,905,731 people shows a poor positive correlation between the proportion of Koreans and household income with householder over the age of 65 in the United States with a correlation coefficient (R) of 0.146 and weighted average of $67,472. Similarly, the statistical analysis conducted on geographies consisting of 230,476,879 people shows no correlation between the proportion of Apache and household income with householder over the age of 65 in the United States with a correlation coefficient (R) of -0.011 and weighted average of $54,668, a difference of 23.4%.
Householder Income Over 65 years Correlation Summary
| Measurement | Korean | Apache |
| Minimum | $33,125 | $12,094 |
| Maximum | $105,510 | $84,879 |
| Range | $72,385 | $72,785 |
| Mean | $74,525 | $43,630 |
| Median | $73,782 | $45,246 |
| Interquartile 25% (IQ1) | $66,806 | $33,376 |
| Interquartile 75% (IQ3) | $85,369 | $53,465 |
| Interquartile Range (IQR) | $18,562 | $20,089 |
| Standard Deviation (Sample) | $14,819 | $16,595 |
| Standard Deviation (Population) | $14,750 | $16,369 |
Similar Demographics by Householder Income Over 65 years
Demographics Similar to Koreans by Householder Income Over 65 years
In terms of householder income over 65 years, the demographic groups most similar to Koreans are Immigrants from Asia ($67,594, a difference of 0.18%), New Zealander ($67,333, a difference of 0.21%), Latvian ($67,326, a difference of 0.22%), Russian ($67,626, a difference of 0.23%), and Immigrants from South Africa ($67,234, a difference of 0.35%).
| Demographics | Rating | Rank | Householder Income Over 65 years |
| Immigrants | Ireland | 100.0 /100 | #34 | Exceptional $68,495 |
| Tongans | 100.0 /100 | #35 | Exceptional $68,235 |
| Immigrants | Austria | 99.9 /100 | #36 | Exceptional $68,208 |
| Turks | 99.9 /100 | #37 | Exceptional $68,037 |
| Estonians | 99.9 /100 | #38 | Exceptional $67,926 |
| Russians | 99.9 /100 | #39 | Exceptional $67,626 |
| Immigrants | Asia | 99.9 /100 | #40 | Exceptional $67,594 |
| Koreans | 99.9 /100 | #41 | Exceptional $67,472 |
| New Zealanders | 99.9 /100 | #42 | Exceptional $67,333 |
| Latvians | 99.9 /100 | #43 | Exceptional $67,326 |
| Immigrants | South Africa | 99.9 /100 | #44 | Exceptional $67,234 |
| Immigrants | Afghanistan | 99.8 /100 | #45 | Exceptional $67,007 |
| Cambodians | 99.8 /100 | #46 | Exceptional $66,892 |
| Australians | 99.8 /100 | #47 | Exceptional $66,891 |
| Immigrants | France | 99.8 /100 | #48 | Exceptional $66,826 |
Demographics Similar to Apache by Householder Income Over 65 years
In terms of householder income over 65 years, the demographic groups most similar to Apache are French American Indian ($54,699, a difference of 0.060%), Bangladeshi ($54,719, a difference of 0.090%), Belizean ($54,580, a difference of 0.16%), Jamaican ($54,560, a difference of 0.20%), and Guatemalan ($54,526, a difference of 0.26%).
| Demographics | Rating | Rank | Householder Income Over 65 years |
| Trinidadians and Tobagonians | 0.3 /100 | #257 | Tragic $55,327 |
| Ecuadorians | 0.2 /100 | #258 | Tragic $54,958 |
| West Indians | 0.2 /100 | #259 | Tragic $54,936 |
| Immigrants | West Indies | 0.2 /100 | #260 | Tragic $54,927 |
| Comanche | 0.2 /100 | #261 | Tragic $54,922 |
| Bangladeshis | 0.1 /100 | #262 | Tragic $54,719 |
| French American Indians | 0.1 /100 | #263 | Tragic $54,699 |
| Apache | 0.1 /100 | #264 | Tragic $54,668 |
| Belizeans | 0.1 /100 | #265 | Tragic $54,580 |
| Jamaicans | 0.1 /100 | #266 | Tragic $54,560 |
| Guatemalans | 0.1 /100 | #267 | Tragic $54,526 |
| Immigrants | Zaire | 0.1 /100 | #268 | Tragic $54,512 |
| Nicaraguans | 0.1 /100 | #269 | Tragic $54,474 |
| Immigrants | Senegal | 0.1 /100 | #270 | Tragic $54,447 |
| Liberians | 0.1 /100 | #271 | Tragic $54,356 |