Sierra Leonean vs Uruguayan Single Father Poverty
COMPARE
Sierra Leonean
Uruguayan
Single Father Poverty
Single Father Poverty Comparison
Sierra Leoneans
Uruguayans
17.2%
SINGLE FATHER POVERTY
0.8/ 100
METRIC RATING
255th/ 347
METRIC RANK
15.9%
SINGLE FATHER POVERTY
92.1/ 100
METRIC RATING
120th/ 347
METRIC RANK
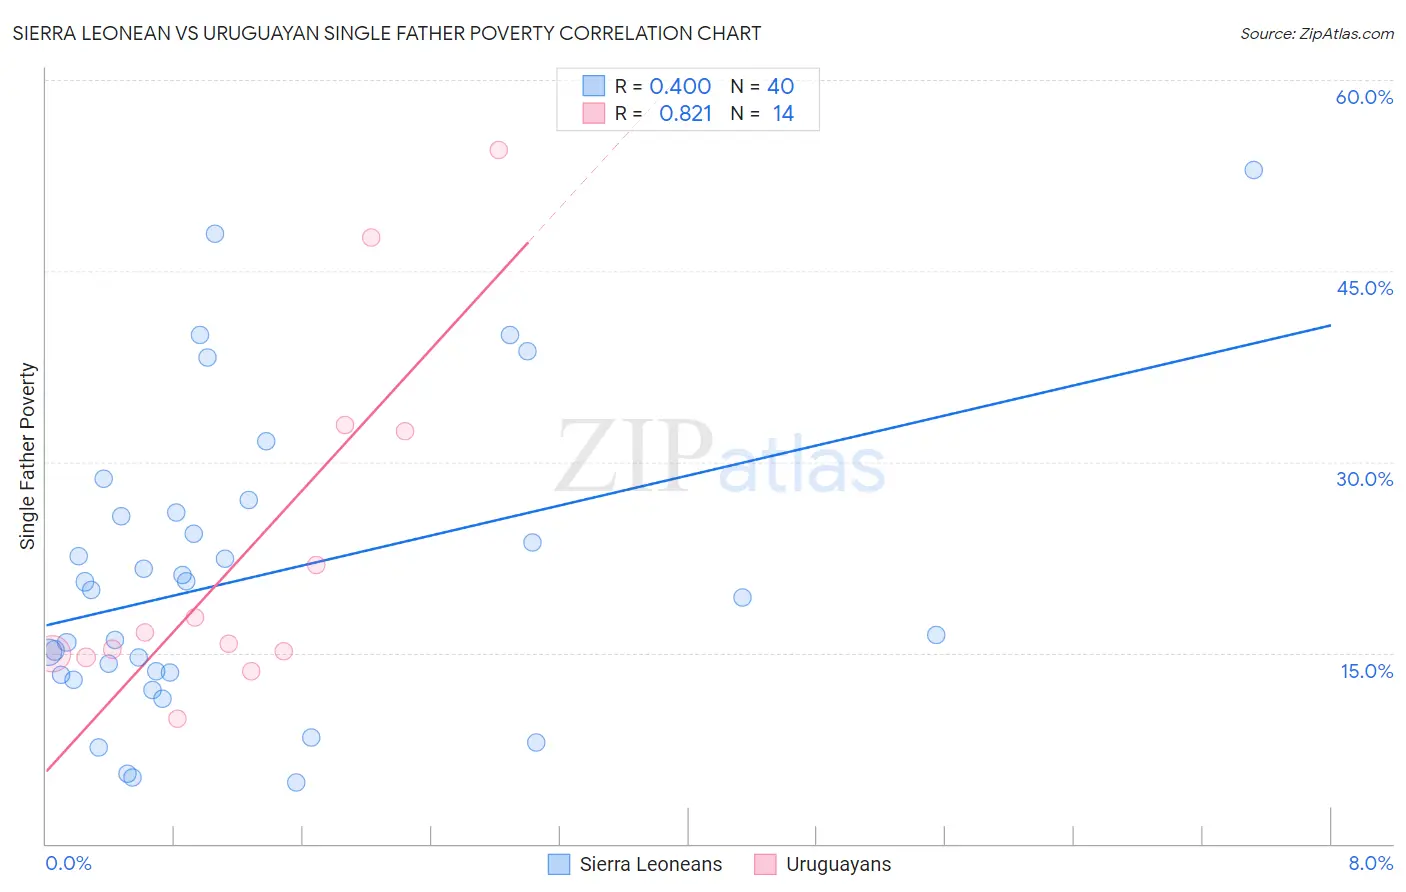
Sierra Leonean vs Uruguayan Single Father Poverty Correlation Chart
The statistical analysis conducted on geographies consisting of 77,262,166 people shows a mild positive correlation between the proportion of Sierra Leoneans and poverty level among single fathers in the United States with a correlation coefficient (R) of 0.400 and weighted average of 17.2%. Similarly, the statistical analysis conducted on geographies consisting of 126,833,155 people shows a very strong positive correlation between the proportion of Uruguayans and poverty level among single fathers in the United States with a correlation coefficient (R) of 0.821 and weighted average of 15.9%, a difference of 8.3%.
Single Father Poverty Correlation Summary
| Measurement | Sierra Leonean | Uruguayan |
| Minimum | 4.8% | 9.8% |
| Maximum | 52.9% | 54.5% |
| Range | 48.2% | 44.7% |
| Mean | 20.9% | 23.1% |
| Median | 19.7% | 16.1% |
| Interquartile 25% (IQ1) | 13.4% | 15.0% |
| Interquartile 75% (IQ3) | 25.9% | 32.4% |
| Interquartile Range (IQR) | 12.5% | 17.4% |
| Standard Deviation (Sample) | 11.6% | 13.7% |
| Standard Deviation (Population) | 11.5% | 13.2% |
Similar Demographics by Single Father Poverty
Demographics Similar to Sierra Leoneans by Single Father Poverty
In terms of single father poverty, the demographic groups most similar to Sierra Leoneans are Immigrants from Haiti (17.2%, a difference of 0.010%), Immigrants from Albania (17.2%, a difference of 0.090%), Albanian (17.2%, a difference of 0.11%), Immigrants from Jamaica (17.2%, a difference of 0.14%), and Immigrants from Honduras (17.1%, a difference of 0.17%).
| Demographics | Rating | Rank | Single Father Poverty |
| Czechoslovakians | 1.3 /100 | #248 | Tragic 17.1% |
| Canadians | 1.3 /100 | #249 | Tragic 17.1% |
| Austrians | 1.1 /100 | #250 | Tragic 17.1% |
| Luxembourgers | 1.1 /100 | #251 | Tragic 17.1% |
| Croatians | 1.0 /100 | #252 | Tragic 17.1% |
| Cree | 1.0 /100 | #253 | Tragic 17.1% |
| Immigrants | Honduras | 0.9 /100 | #254 | Tragic 17.1% |
| Sierra Leoneans | 0.8 /100 | #255 | Tragic 17.2% |
| Immigrants | Haiti | 0.8 /100 | #256 | Tragic 17.2% |
| Immigrants | Albania | 0.7 /100 | #257 | Tragic 17.2% |
| Albanians | 0.7 /100 | #258 | Tragic 17.2% |
| Immigrants | Jamaica | 0.7 /100 | #259 | Tragic 17.2% |
| Spaniards | 0.6 /100 | #260 | Tragic 17.2% |
| Swiss | 0.5 /100 | #261 | Tragic 17.3% |
| Immigrants | Zaire | 0.4 /100 | #262 | Tragic 17.3% |
Demographics Similar to Uruguayans by Single Father Poverty
In terms of single father poverty, the demographic groups most similar to Uruguayans are Immigrants (15.9%, a difference of 0.020%), Immigrants from Belarus (15.8%, a difference of 0.060%), Immigrants from Eastern Europe (15.8%, a difference of 0.070%), Sudanese (15.9%, a difference of 0.080%), and Immigrants from Colombia (15.8%, a difference of 0.090%).
| Demographics | Rating | Rank | Single Father Poverty |
| Danes | 94.5 /100 | #113 | Exceptional 15.8% |
| Argentineans | 94.4 /100 | #114 | Exceptional 15.8% |
| Immigrants | Thailand | 93.6 /100 | #115 | Exceptional 15.8% |
| Immigrants | Argentina | 92.8 /100 | #116 | Exceptional 15.8% |
| Immigrants | Colombia | 92.6 /100 | #117 | Exceptional 15.8% |
| Immigrants | Eastern Europe | 92.5 /100 | #118 | Exceptional 15.8% |
| Immigrants | Belarus | 92.4 /100 | #119 | Exceptional 15.8% |
| Uruguayans | 92.1 /100 | #120 | Exceptional 15.9% |
| Immigrants | Immigrants | 91.9 /100 | #121 | Exceptional 15.9% |
| Sudanese | 91.6 /100 | #122 | Exceptional 15.9% |
| Palestinians | 91.3 /100 | #123 | Exceptional 15.9% |
| Immigrants | Panama | 91.3 /100 | #124 | Exceptional 15.9% |
| Iraqis | 91.2 /100 | #125 | Exceptional 15.9% |
| Hmong | 91.1 /100 | #126 | Exceptional 15.9% |
| Immigrants | Liberia | 91.1 /100 | #127 | Exceptional 15.9% |