Kiowa vs Uruguayan Divorced or Separated
COMPARE
Kiowa
Uruguayan
Divorced or Separated
Divorced or Separated Comparison
Kiowa
Uruguayans
14.5%
DIVORCED OR SEPARATED
0.0/ 100
METRIC RATING
345th/ 347
METRIC RANK
12.4%
DIVORCED OR SEPARATED
3.4/ 100
METRIC RATING
241st/ 347
METRIC RANK
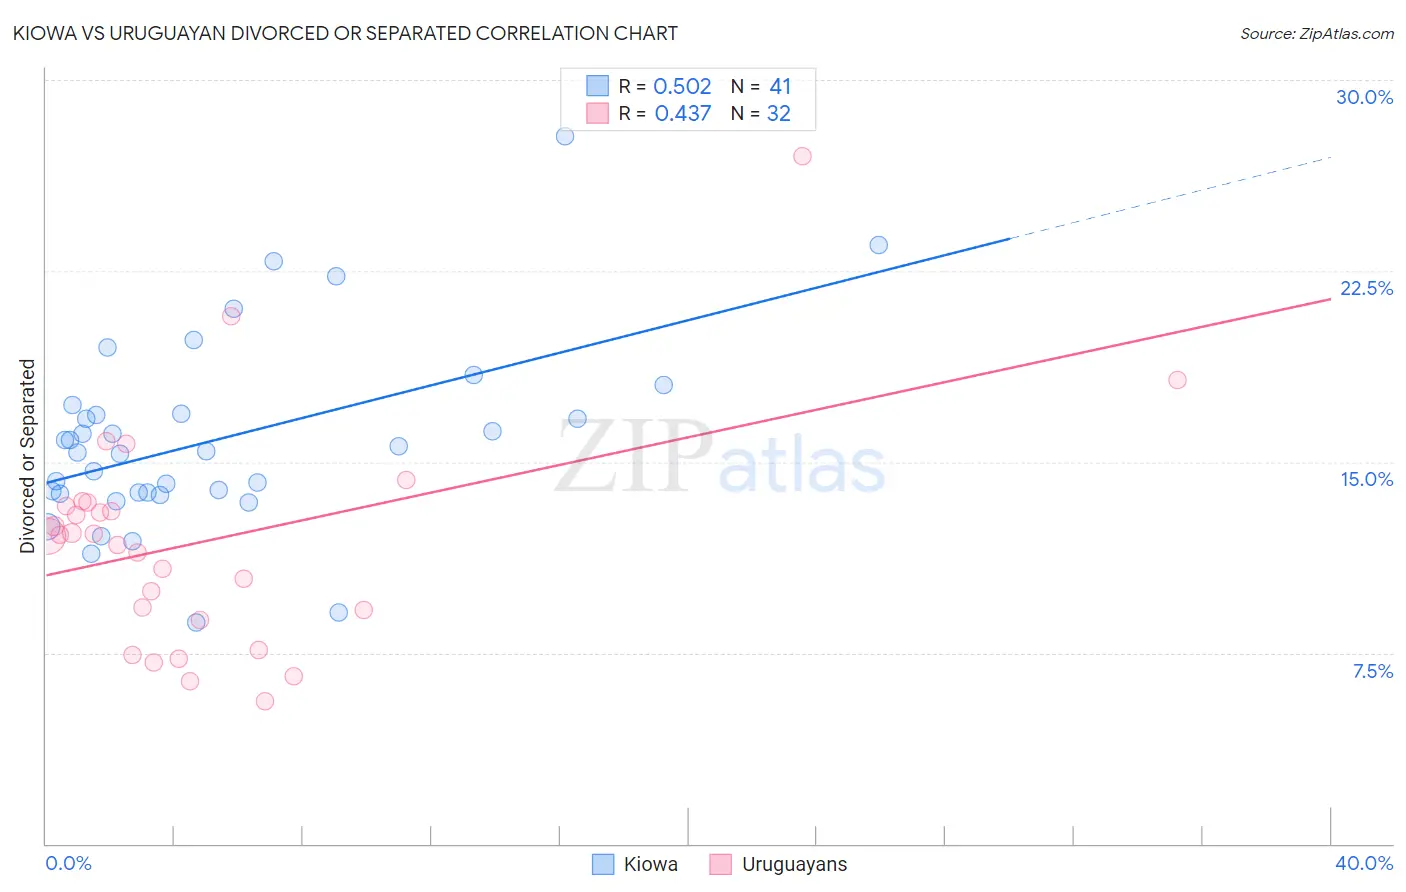
Kiowa vs Uruguayan Divorced or Separated Correlation Chart
The statistical analysis conducted on geographies consisting of 56,101,840 people shows a substantial positive correlation between the proportion of Kiowa and percentage of population currently divorced or separated in the United States with a correlation coefficient (R) of 0.502 and weighted average of 14.5%. Similarly, the statistical analysis conducted on geographies consisting of 144,765,430 people shows a moderate positive correlation between the proportion of Uruguayans and percentage of population currently divorced or separated in the United States with a correlation coefficient (R) of 0.437 and weighted average of 12.4%, a difference of 17.0%.
Divorced or Separated Correlation Summary
| Measurement | Kiowa | Uruguayan |
| Minimum | 8.7% | 5.6% |
| Maximum | 27.8% | 27.0% |
| Range | 19.1% | 21.4% |
| Mean | 15.9% | 11.9% |
| Median | 15.4% | 12.1% |
| Interquartile 25% (IQ1) | 13.8% | 9.0% |
| Interquartile 75% (IQ3) | 17.1% | 13.3% |
| Interquartile Range (IQR) | 3.3% | 4.3% |
| Standard Deviation (Sample) | 3.8% | 4.4% |
| Standard Deviation (Population) | 3.7% | 4.3% |
Similar Demographics by Divorced or Separated
Demographics Similar to Kiowa by Divorced or Separated
In terms of divorced or separated, the demographic groups most similar to Kiowa are Cuban (14.5%, a difference of 0.10%), Creek (14.4%, a difference of 0.77%), Seminole (14.3%, a difference of 1.8%), Bahamian (14.2%, a difference of 2.0%), and Arapaho (14.8%, a difference of 2.1%).
| Demographics | Rating | Rank | Divorced or Separated |
| Puerto Ricans | 0.0 /100 | #333 | Tragic 13.9% |
| Immigrants | Bahamas | 0.0 /100 | #334 | Tragic 13.9% |
| Dutch West Indians | 0.0 /100 | #335 | Tragic 14.0% |
| Shoshone | 0.0 /100 | #336 | Tragic 14.0% |
| Crow | 0.0 /100 | #337 | Tragic 14.1% |
| Choctaw | 0.0 /100 | #338 | Tragic 14.1% |
| Colville | 0.0 /100 | #339 | Tragic 14.2% |
| Chickasaw | 0.0 /100 | #340 | Tragic 14.2% |
| Bahamians | 0.0 /100 | #341 | Tragic 14.2% |
| Seminole | 0.0 /100 | #342 | Tragic 14.3% |
| Creek | 0.0 /100 | #343 | Tragic 14.4% |
| Cubans | 0.0 /100 | #344 | Tragic 14.5% |
| Kiowa | 0.0 /100 | #345 | Tragic 14.5% |
| Arapaho | 0.0 /100 | #346 | Tragic 14.8% |
| Immigrants | Cuba | 0.0 /100 | #347 | Tragic 15.2% |
Demographics Similar to Uruguayans by Divorced or Separated
In terms of divorced or separated, the demographic groups most similar to Uruguayans are British West Indian (12.4%, a difference of 0.090%), Dutch (12.4%, a difference of 0.090%), Immigrants from Germany (12.4%, a difference of 0.14%), Sudanese (12.4%, a difference of 0.15%), and Immigrants from Latin America (12.4%, a difference of 0.15%).
| Demographics | Rating | Rank | Divorced or Separated |
| West Indians | 4.4 /100 | #234 | Tragic 12.4% |
| Immigrants | Bosnia and Herzegovina | 4.3 /100 | #235 | Tragic 12.4% |
| Colombians | 4.2 /100 | #236 | Tragic 12.4% |
| Immigrants | Laos | 4.2 /100 | #237 | Tragic 12.4% |
| Sudanese | 4.0 /100 | #238 | Tragic 12.4% |
| Immigrants | Germany | 4.0 /100 | #239 | Tragic 12.4% |
| British West Indians | 3.7 /100 | #240 | Tragic 12.4% |
| Uruguayans | 3.4 /100 | #241 | Tragic 12.4% |
| Dutch | 3.1 /100 | #242 | Tragic 12.4% |
| Immigrants | Latin America | 2.8 /100 | #243 | Tragic 12.4% |
| Alaska Natives | 2.5 /100 | #244 | Tragic 12.4% |
| Hispanics or Latinos | 2.0 /100 | #245 | Tragic 12.5% |
| Immigrants | West Indies | 1.9 /100 | #246 | Tragic 12.5% |
| Germans | 1.8 /100 | #247 | Tragic 12.5% |
| Nepalese | 1.8 /100 | #248 | Tragic 12.5% |