Guamanian/Chamorro vs Uruguayan Single Father Poverty
COMPARE
Guamanian/Chamorro
Uruguayan
Single Father Poverty
Single Father Poverty Comparison
Guamanians/Chamorros
Uruguayans
15.1%
SINGLE FATHER POVERTY
99.9/ 100
METRIC RATING
59th/ 347
METRIC RANK
15.9%
SINGLE FATHER POVERTY
92.1/ 100
METRIC RATING
120th/ 347
METRIC RANK
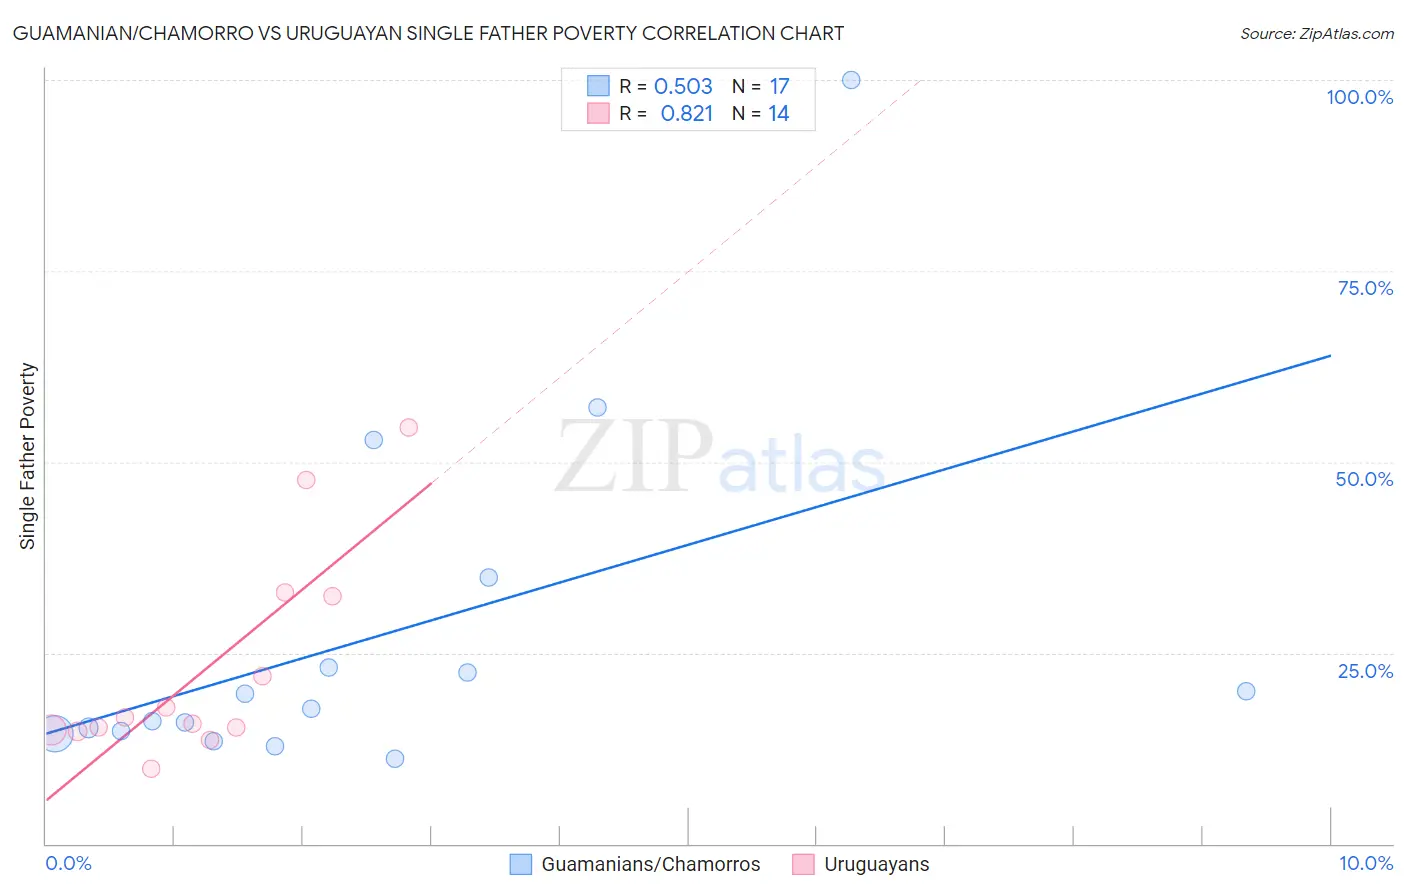
Guamanian/Chamorro vs Uruguayan Single Father Poverty Correlation Chart
The statistical analysis conducted on geographies consisting of 191,371,634 people shows a substantial positive correlation between the proportion of Guamanians/Chamorros and poverty level among single fathers in the United States with a correlation coefficient (R) of 0.503 and weighted average of 15.1%. Similarly, the statistical analysis conducted on geographies consisting of 126,833,155 people shows a very strong positive correlation between the proportion of Uruguayans and poverty level among single fathers in the United States with a correlation coefficient (R) of 0.821 and weighted average of 15.9%, a difference of 5.0%.
Single Father Poverty Correlation Summary
| Measurement | Guamanian/Chamorro | Uruguayan |
| Minimum | 11.2% | 9.8% |
| Maximum | 100.0% | 54.5% |
| Range | 88.8% | 44.7% |
| Mean | 27.1% | 23.1% |
| Median | 17.6% | 16.1% |
| Interquartile 25% (IQ1) | 14.6% | 15.0% |
| Interquartile 75% (IQ3) | 29.0% | 32.4% |
| Interquartile Range (IQR) | 14.4% | 17.4% |
| Standard Deviation (Sample) | 23.1% | 13.7% |
| Standard Deviation (Population) | 22.4% | 13.2% |
Similar Demographics by Single Father Poverty
Demographics Similar to Guamanians/Chamorros by Single Father Poverty
In terms of single father poverty, the demographic groups most similar to Guamanians/Chamorros are Hawaiian (15.1%, a difference of 0.10%), Laotian (15.1%, a difference of 0.15%), Immigrants from Laos (15.1%, a difference of 0.24%), Puget Sound Salish (15.2%, a difference of 0.40%), and Immigrants from Bosnia and Herzegovina (15.2%, a difference of 0.45%).
| Demographics | Rating | Rank | Single Father Poverty |
| Immigrants | El Salvador | 99.9 /100 | #52 | Exceptional 15.0% |
| Immigrants | Kenya | 99.9 /100 | #53 | Exceptional 15.0% |
| Immigrants | Uzbekistan | 99.9 /100 | #54 | Exceptional 15.0% |
| Immigrants | Bulgaria | 99.9 /100 | #55 | Exceptional 15.0% |
| Immigrants | Laos | 99.9 /100 | #56 | Exceptional 15.1% |
| Laotians | 99.9 /100 | #57 | Exceptional 15.1% |
| Hawaiians | 99.9 /100 | #58 | Exceptional 15.1% |
| Guamanians/Chamorros | 99.9 /100 | #59 | Exceptional 15.1% |
| Puget Sound Salish | 99.8 /100 | #60 | Exceptional 15.2% |
| Immigrants | Bosnia and Herzegovina | 99.8 /100 | #61 | Exceptional 15.2% |
| Immigrants | Armenia | 99.8 /100 | #62 | Exceptional 15.2% |
| Immigrants | Sweden | 99.8 /100 | #63 | Exceptional 15.2% |
| Bangladeshis | 99.8 /100 | #64 | Exceptional 15.2% |
| Immigrants | Malaysia | 99.8 /100 | #65 | Exceptional 15.2% |
| Immigrants | Moldova | 99.8 /100 | #66 | Exceptional 15.2% |
Demographics Similar to Uruguayans by Single Father Poverty
In terms of single father poverty, the demographic groups most similar to Uruguayans are Immigrants (15.9%, a difference of 0.020%), Immigrants from Belarus (15.8%, a difference of 0.060%), Immigrants from Eastern Europe (15.8%, a difference of 0.070%), Sudanese (15.9%, a difference of 0.080%), and Immigrants from Colombia (15.8%, a difference of 0.090%).
| Demographics | Rating | Rank | Single Father Poverty |
| Danes | 94.5 /100 | #113 | Exceptional 15.8% |
| Argentineans | 94.4 /100 | #114 | Exceptional 15.8% |
| Immigrants | Thailand | 93.6 /100 | #115 | Exceptional 15.8% |
| Immigrants | Argentina | 92.8 /100 | #116 | Exceptional 15.8% |
| Immigrants | Colombia | 92.6 /100 | #117 | Exceptional 15.8% |
| Immigrants | Eastern Europe | 92.5 /100 | #118 | Exceptional 15.8% |
| Immigrants | Belarus | 92.4 /100 | #119 | Exceptional 15.8% |
| Uruguayans | 92.1 /100 | #120 | Exceptional 15.9% |
| Immigrants | Immigrants | 91.9 /100 | #121 | Exceptional 15.9% |
| Sudanese | 91.6 /100 | #122 | Exceptional 15.9% |
| Palestinians | 91.3 /100 | #123 | Exceptional 15.9% |
| Immigrants | Panama | 91.3 /100 | #124 | Exceptional 15.9% |
| Iraqis | 91.2 /100 | #125 | Exceptional 15.9% |
| Hmong | 91.1 /100 | #126 | Exceptional 15.9% |
| Immigrants | Liberia | 91.1 /100 | #127 | Exceptional 15.9% |