Kenyan vs Ugandan Female Poverty
COMPARE
Kenyan
Ugandan
Female Poverty
Female Poverty Comparison
Kenyans
Ugandans
13.5%
FEMALE POVERTY
43.8/ 100
METRIC RATING
183rd/ 347
METRIC RANK
14.0%
FEMALE POVERTY
15.4/ 100
METRIC RATING
205th/ 347
METRIC RANK
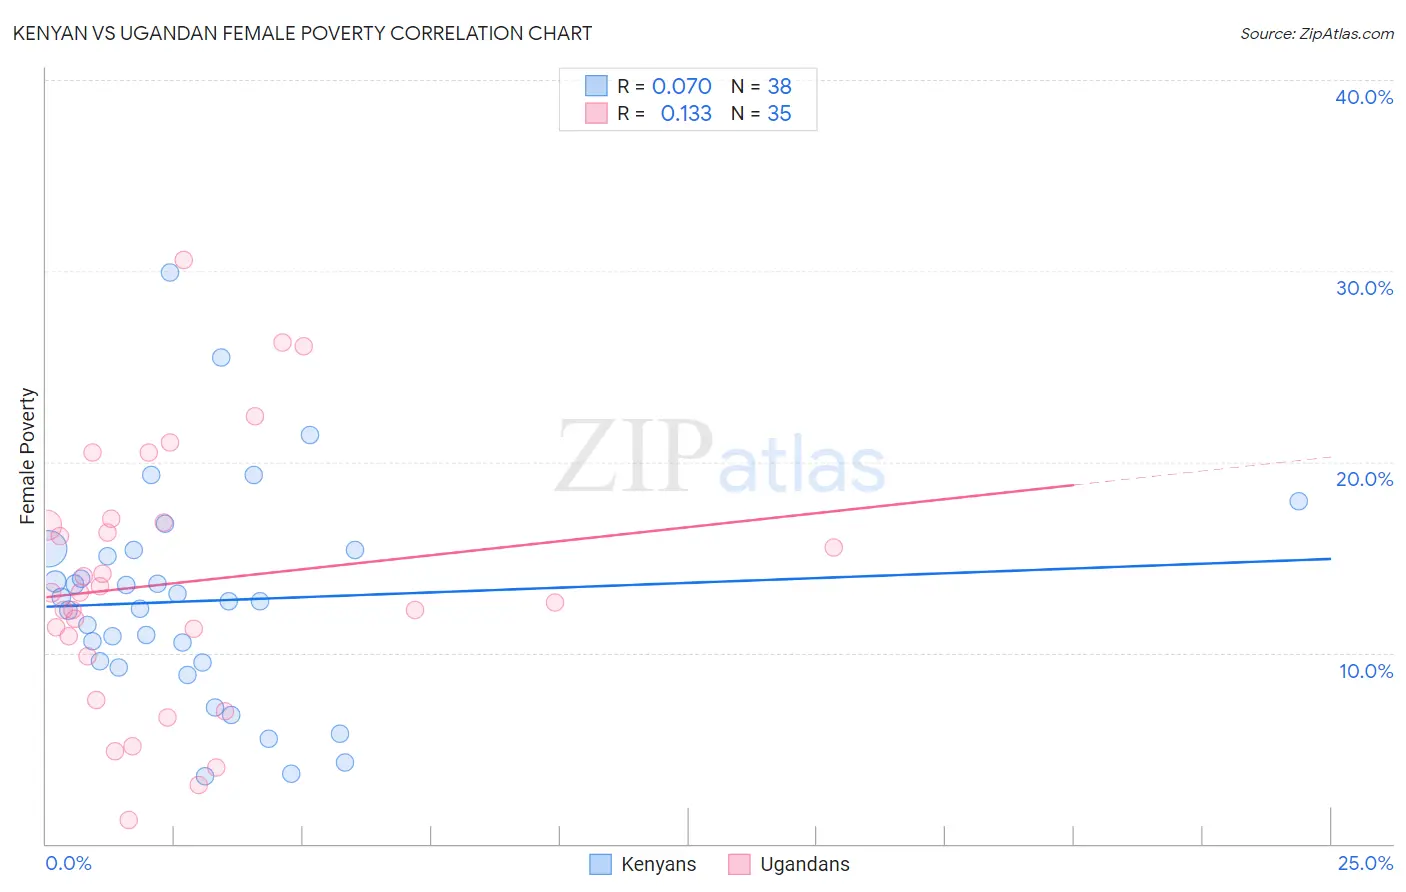
Kenyan vs Ugandan Female Poverty Correlation Chart
The statistical analysis conducted on geographies consisting of 168,133,672 people shows a slight positive correlation between the proportion of Kenyans and poverty level among females in the United States with a correlation coefficient (R) of 0.070 and weighted average of 13.5%. Similarly, the statistical analysis conducted on geographies consisting of 93,995,237 people shows a poor positive correlation between the proportion of Ugandans and poverty level among females in the United States with a correlation coefficient (R) of 0.133 and weighted average of 14.0%, a difference of 3.5%.
Female Poverty Correlation Summary
| Measurement | Kenyan | Ugandan |
| Minimum | 3.5% | 1.3% |
| Maximum | 29.9% | 30.6% |
| Range | 26.4% | 29.3% |
| Mean | 12.7% | 13.6% |
| Median | 12.7% | 13.1% |
| Interquartile 25% (IQ1) | 9.5% | 9.8% |
| Interquartile 75% (IQ3) | 15.4% | 16.8% |
| Interquartile Range (IQR) | 5.9% | 7.0% |
| Standard Deviation (Sample) | 5.6% | 6.8% |
| Standard Deviation (Population) | 5.5% | 6.7% |
Similar Demographics by Female Poverty
Demographics Similar to Kenyans by Female Poverty
In terms of female poverty, the demographic groups most similar to Kenyans are Immigrants from Sierra Leone (13.5%, a difference of 0.060%), Venezuelan (13.5%, a difference of 0.070%), Immigrants from Colombia (13.5%, a difference of 0.070%), South American (13.5%, a difference of 0.10%), and Immigrants from Cameroon (13.5%, a difference of 0.17%).
| Demographics | Rating | Rank | Female Poverty |
| Immigrants | Spain | 49.9 /100 | #176 | Average 13.4% |
| Immigrants | Morocco | 49.4 /100 | #177 | Average 13.4% |
| Israelis | 49.1 /100 | #178 | Average 13.5% |
| Immigrants | Syria | 48.8 /100 | #179 | Average 13.5% |
| South Americans | 44.8 /100 | #180 | Average 13.5% |
| Venezuelans | 44.5 /100 | #181 | Average 13.5% |
| Immigrants | Colombia | 44.5 /100 | #182 | Average 13.5% |
| Kenyans | 43.8 /100 | #183 | Average 13.5% |
| Immigrants | Sierra Leone | 43.2 /100 | #184 | Average 13.5% |
| Immigrants | Cameroon | 42.0 /100 | #185 | Average 13.5% |
| Immigrants | Portugal | 41.5 /100 | #186 | Average 13.6% |
| Immigrants | Venezuela | 41.0 /100 | #187 | Average 13.6% |
| Hawaiians | 39.9 /100 | #188 | Fair 13.6% |
| Uruguayans | 39.8 /100 | #189 | Fair 13.6% |
| Sierra Leoneans | 33.1 /100 | #190 | Fair 13.7% |
Demographics Similar to Ugandans by Female Poverty
In terms of female poverty, the demographic groups most similar to Ugandans are Immigrants from Uruguay (14.0%, a difference of 0.27%), Spaniard (13.9%, a difference of 0.56%), Immigrants from Western Asia (13.9%, a difference of 0.84%), Hmong (13.9%, a difference of 0.89%), and Immigrants from Kenya (13.9%, a difference of 0.90%).
| Demographics | Rating | Rank | Female Poverty |
| Immigrants | Uganda | 28.5 /100 | #198 | Fair 13.7% |
| Immigrants | Lebanon | 25.6 /100 | #199 | Fair 13.8% |
| Spanish | 21.4 /100 | #200 | Fair 13.9% |
| Immigrants | Kenya | 21.1 /100 | #201 | Fair 13.9% |
| Hmong | 21.1 /100 | #202 | Fair 13.9% |
| Immigrants | Western Asia | 20.7 /100 | #203 | Fair 13.9% |
| Spaniards | 18.9 /100 | #204 | Poor 13.9% |
| Ugandans | 15.4 /100 | #205 | Poor 14.0% |
| Immigrants | Uruguay | 14.0 /100 | #206 | Poor 14.0% |
| Immigrants | Eastern Africa | 9.0 /100 | #207 | Tragic 14.2% |
| Immigrants | Azores | 7.9 /100 | #208 | Tragic 14.2% |
| Panamanians | 7.7 /100 | #209 | Tragic 14.2% |
| Malaysians | 7.4 /100 | #210 | Tragic 14.3% |
| Moroccans | 7.2 /100 | #211 | Tragic 14.3% |
| Bermudans | 5.5 /100 | #212 | Tragic 14.4% |