Immigrants from Micronesia vs Ugandan Female Poverty
COMPARE
Immigrants from Micronesia
Ugandan
Female Poverty
Female Poverty Comparison
Immigrants from Micronesia
Ugandans
14.6%
FEMALE POVERTY
2.8/ 100
METRIC RATING
225th/ 347
METRIC RANK
14.0%
FEMALE POVERTY
15.4/ 100
METRIC RATING
205th/ 347
METRIC RANK
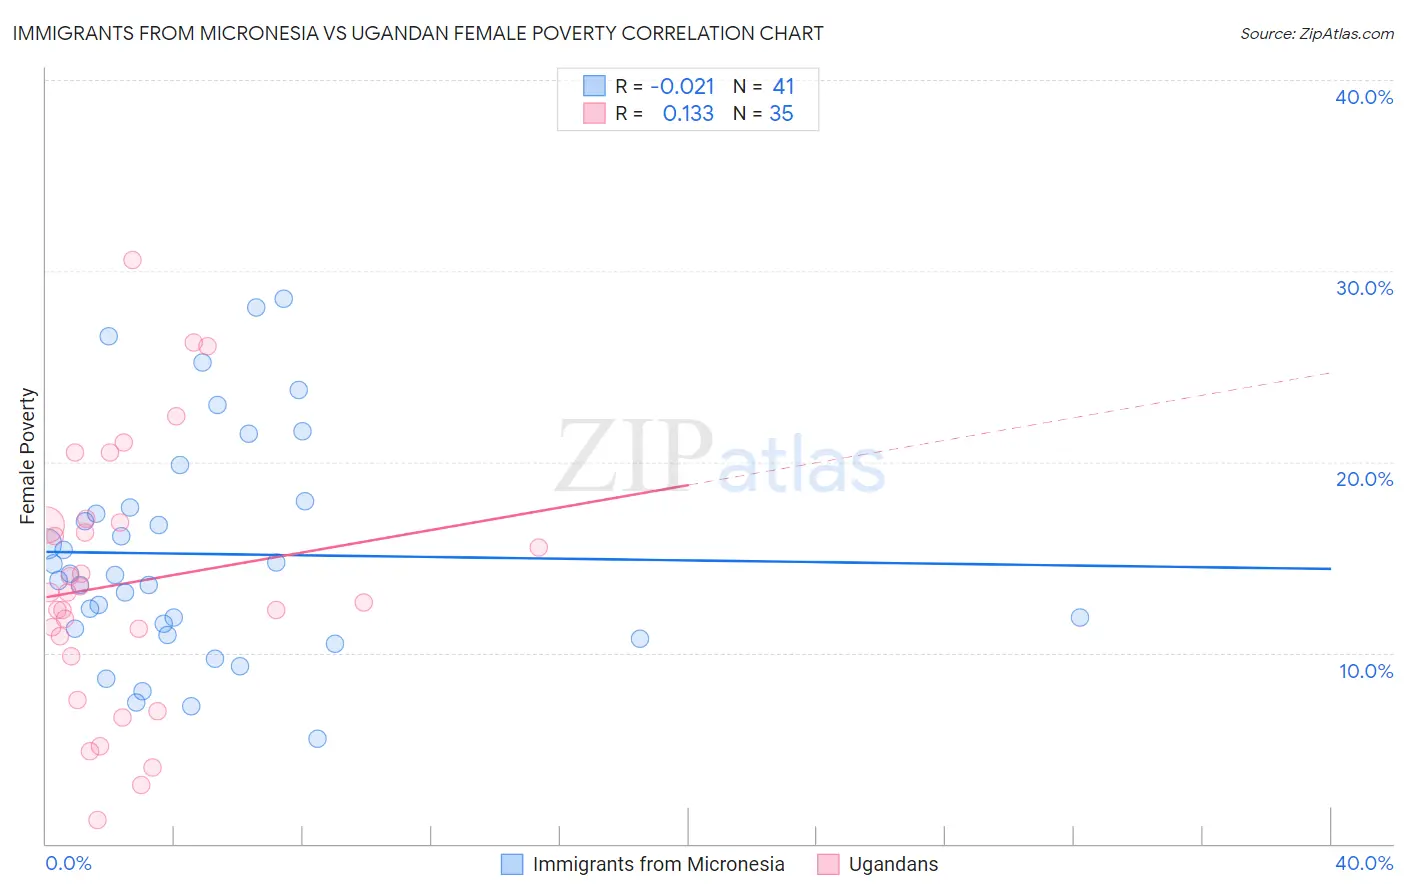
Immigrants from Micronesia vs Ugandan Female Poverty Correlation Chart
The statistical analysis conducted on geographies consisting of 61,598,516 people shows no correlation between the proportion of Immigrants from Micronesia and poverty level among females in the United States with a correlation coefficient (R) of -0.021 and weighted average of 14.6%. Similarly, the statistical analysis conducted on geographies consisting of 93,995,237 people shows a poor positive correlation between the proportion of Ugandans and poverty level among females in the United States with a correlation coefficient (R) of 0.133 and weighted average of 14.0%, a difference of 4.3%.
Female Poverty Correlation Summary
| Measurement | Immigrants from Micronesia | Ugandan |
| Minimum | 5.5% | 1.3% |
| Maximum | 28.6% | 30.6% |
| Range | 23.0% | 29.3% |
| Mean | 15.2% | 13.6% |
| Median | 14.1% | 13.1% |
| Interquartile 25% (IQ1) | 11.1% | 9.8% |
| Interquartile 75% (IQ3) | 17.8% | 16.8% |
| Interquartile Range (IQR) | 6.7% | 7.0% |
| Standard Deviation (Sample) | 5.8% | 6.8% |
| Standard Deviation (Population) | 5.7% | 6.7% |
Demographics Similar to Immigrants from Micronesia and Ugandans by Female Poverty
In terms of female poverty, the demographic groups most similar to Immigrants from Micronesia are American (14.6%, a difference of 0.0%), Immigrants from Africa (14.5%, a difference of 0.40%), Nonimmigrants (14.5%, a difference of 0.63%), Immigrants from Cambodia (14.5%, a difference of 0.66%), and Alsatian (14.5%, a difference of 0.85%). Similarly, the demographic groups most similar to Ugandans are Immigrants from Uruguay (14.0%, a difference of 0.27%), Immigrants from Eastern Africa (14.2%, a difference of 1.4%), Immigrants from the Azores (14.2%, a difference of 1.8%), Panamanian (14.2%, a difference of 1.8%), and Malaysian (14.3%, a difference of 1.9%).
| Demographics | Rating | Rank | Female Poverty |
| Ugandans | 15.4 /100 | #205 | Poor 14.0% |
| Immigrants | Uruguay | 14.0 /100 | #206 | Poor 14.0% |
| Immigrants | Eastern Africa | 9.0 /100 | #207 | Tragic 14.2% |
| Immigrants | Azores | 7.9 /100 | #208 | Tragic 14.2% |
| Panamanians | 7.7 /100 | #209 | Tragic 14.2% |
| Malaysians | 7.4 /100 | #210 | Tragic 14.3% |
| Moroccans | 7.2 /100 | #211 | Tragic 14.3% |
| Bermudans | 5.5 /100 | #212 | Tragic 14.4% |
| Alaskan Athabascans | 5.3 /100 | #213 | Tragic 14.4% |
| Marshallese | 5.0 /100 | #214 | Tragic 14.4% |
| Immigrants | Panama | 4.7 /100 | #215 | Tragic 14.4% |
| Immigrants | Thailand | 4.5 /100 | #216 | Tragic 14.4% |
| Immigrants | Immigrants | 4.5 /100 | #217 | Tragic 14.4% |
| Immigrants | Uzbekistan | 4.4 /100 | #218 | Tragic 14.4% |
| Japanese | 4.1 /100 | #219 | Tragic 14.5% |
| Alsatians | 4.0 /100 | #220 | Tragic 14.5% |
| Immigrants | Cambodia | 3.7 /100 | #221 | Tragic 14.5% |
| Immigrants | Nonimmigrants | 3.7 /100 | #222 | Tragic 14.5% |
| Immigrants | Africa | 3.3 /100 | #223 | Tragic 14.5% |
| Americans | 2.8 /100 | #224 | Tragic 14.6% |
| Immigrants | Micronesia | 2.8 /100 | #225 | Tragic 14.6% |