Kenyan vs Immigrants from Nicaragua Female Poverty
COMPARE
Kenyan
Immigrants from Nicaragua
Female Poverty
Female Poverty Comparison
Kenyans
Immigrants from Nicaragua
13.5%
FEMALE POVERTY
43.8/ 100
METRIC RATING
183rd/ 347
METRIC RANK
15.8%
FEMALE POVERTY
0.1/ 100
METRIC RATING
268th/ 347
METRIC RANK
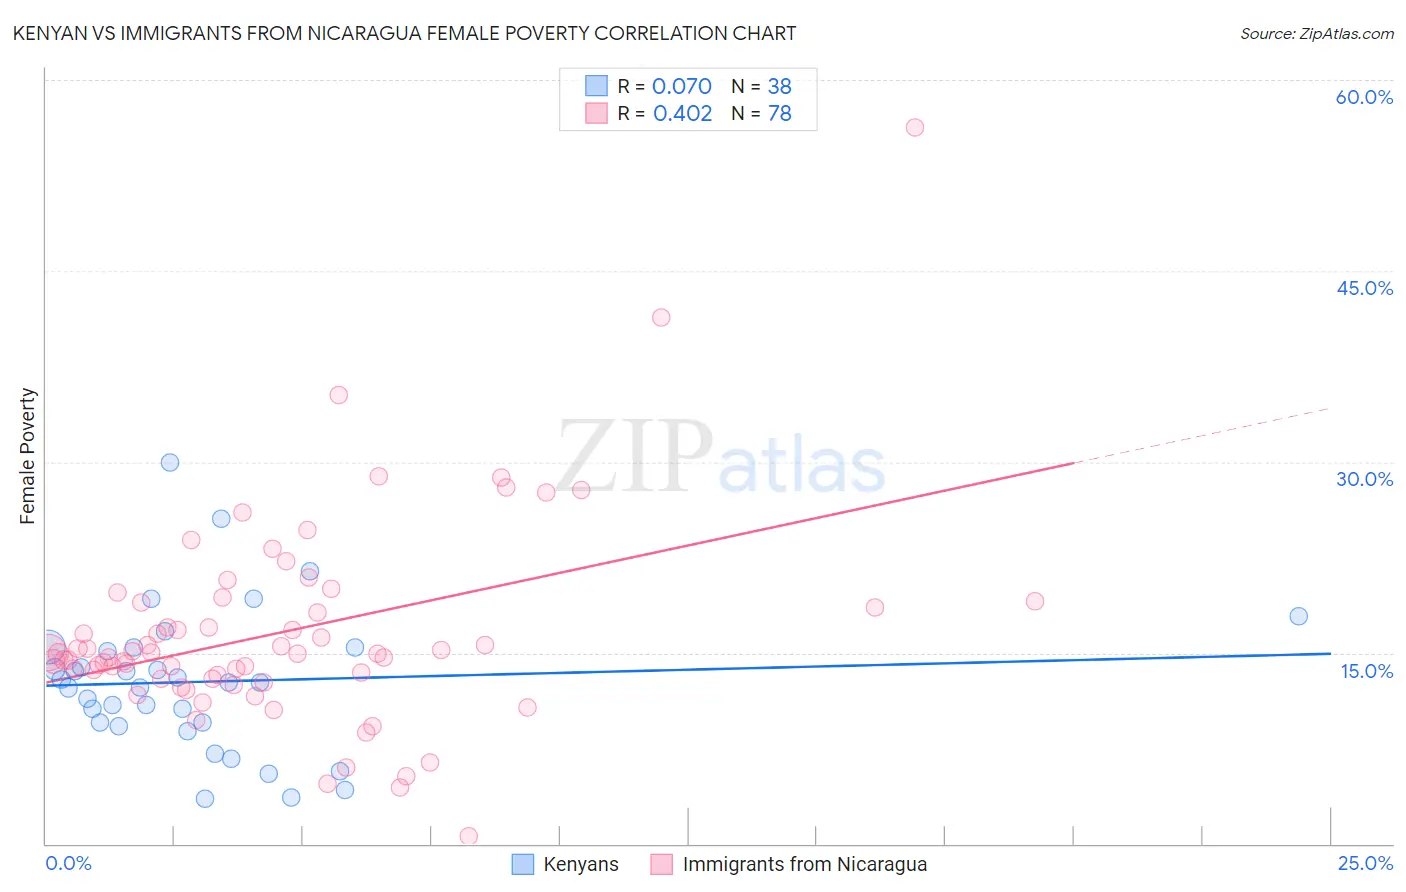
Kenyan vs Immigrants from Nicaragua Female Poverty Correlation Chart
The statistical analysis conducted on geographies consisting of 168,133,672 people shows a slight positive correlation between the proportion of Kenyans and poverty level among females in the United States with a correlation coefficient (R) of 0.070 and weighted average of 13.5%. Similarly, the statistical analysis conducted on geographies consisting of 236,310,787 people shows a moderate positive correlation between the proportion of Immigrants from Nicaragua and poverty level among females in the United States with a correlation coefficient (R) of 0.402 and weighted average of 15.8%, a difference of 16.6%.
Female Poverty Correlation Summary
| Measurement | Kenyan | Immigrants from Nicaragua |
| Minimum | 3.5% | 0.58% |
| Maximum | 29.9% | 56.3% |
| Range | 26.4% | 55.7% |
| Mean | 12.7% | 16.6% |
| Median | 12.7% | 14.9% |
| Interquartile 25% (IQ1) | 9.5% | 13.0% |
| Interquartile 75% (IQ3) | 15.4% | 19.0% |
| Interquartile Range (IQR) | 5.9% | 6.0% |
| Standard Deviation (Sample) | 5.6% | 8.1% |
| Standard Deviation (Population) | 5.5% | 8.0% |
Similar Demographics by Female Poverty
Demographics Similar to Kenyans by Female Poverty
In terms of female poverty, the demographic groups most similar to Kenyans are Immigrants from Sierra Leone (13.5%, a difference of 0.060%), Venezuelan (13.5%, a difference of 0.070%), Immigrants from Colombia (13.5%, a difference of 0.070%), South American (13.5%, a difference of 0.10%), and Immigrants from Cameroon (13.5%, a difference of 0.17%).
| Demographics | Rating | Rank | Female Poverty |
| Immigrants | Spain | 49.9 /100 | #176 | Average 13.4% |
| Immigrants | Morocco | 49.4 /100 | #177 | Average 13.4% |
| Israelis | 49.1 /100 | #178 | Average 13.5% |
| Immigrants | Syria | 48.8 /100 | #179 | Average 13.5% |
| South Americans | 44.8 /100 | #180 | Average 13.5% |
| Venezuelans | 44.5 /100 | #181 | Average 13.5% |
| Immigrants | Colombia | 44.5 /100 | #182 | Average 13.5% |
| Kenyans | 43.8 /100 | #183 | Average 13.5% |
| Immigrants | Sierra Leone | 43.2 /100 | #184 | Average 13.5% |
| Immigrants | Cameroon | 42.0 /100 | #185 | Average 13.5% |
| Immigrants | Portugal | 41.5 /100 | #186 | Average 13.6% |
| Immigrants | Venezuela | 41.0 /100 | #187 | Average 13.6% |
| Hawaiians | 39.9 /100 | #188 | Fair 13.6% |
| Uruguayans | 39.8 /100 | #189 | Fair 13.6% |
| Sierra Leoneans | 33.1 /100 | #190 | Fair 13.7% |
Demographics Similar to Immigrants from Nicaragua by Female Poverty
In terms of female poverty, the demographic groups most similar to Immigrants from Nicaragua are Subsaharan African (15.8%, a difference of 0.060%), Iroquois (15.8%, a difference of 0.37%), Immigrants from El Salvador (15.7%, a difference of 0.49%), Immigrants from Liberia (15.7%, a difference of 0.55%), and Chickasaw (15.9%, a difference of 0.63%).
| Demographics | Rating | Rank | Female Poverty |
| Guyanese | 0.1 /100 | #261 | Tragic 15.6% |
| Mexican American Indians | 0.1 /100 | #262 | Tragic 15.6% |
| Cherokee | 0.1 /100 | #263 | Tragic 15.6% |
| Immigrants | Ecuador | 0.1 /100 | #264 | Tragic 15.6% |
| Immigrants | Liberia | 0.1 /100 | #265 | Tragic 15.7% |
| Immigrants | El Salvador | 0.1 /100 | #266 | Tragic 15.7% |
| Sub-Saharan Africans | 0.1 /100 | #267 | Tragic 15.8% |
| Immigrants | Nicaragua | 0.1 /100 | #268 | Tragic 15.8% |
| Iroquois | 0.1 /100 | #269 | Tragic 15.8% |
| Chickasaw | 0.1 /100 | #270 | Tragic 15.9% |
| Immigrants | St. Vincent and the Grenadines | 0.0 /100 | #271 | Tragic 15.9% |
| Belizeans | 0.0 /100 | #272 | Tragic 15.9% |
| Haitians | 0.0 /100 | #273 | Tragic 15.9% |
| Barbadians | 0.0 /100 | #274 | Tragic 15.9% |
| Immigrants | Barbados | 0.0 /100 | #275 | Tragic 16.0% |