Kenyan vs French Canadian Female Poverty
COMPARE
Kenyan
French Canadian
Female Poverty
Female Poverty Comparison
Kenyans
French Canadians
13.5%
FEMALE POVERTY
43.8/ 100
METRIC RATING
183rd/ 347
METRIC RANK
12.7%
FEMALE POVERTY
90.2/ 100
METRIC RATING
122nd/ 347
METRIC RANK
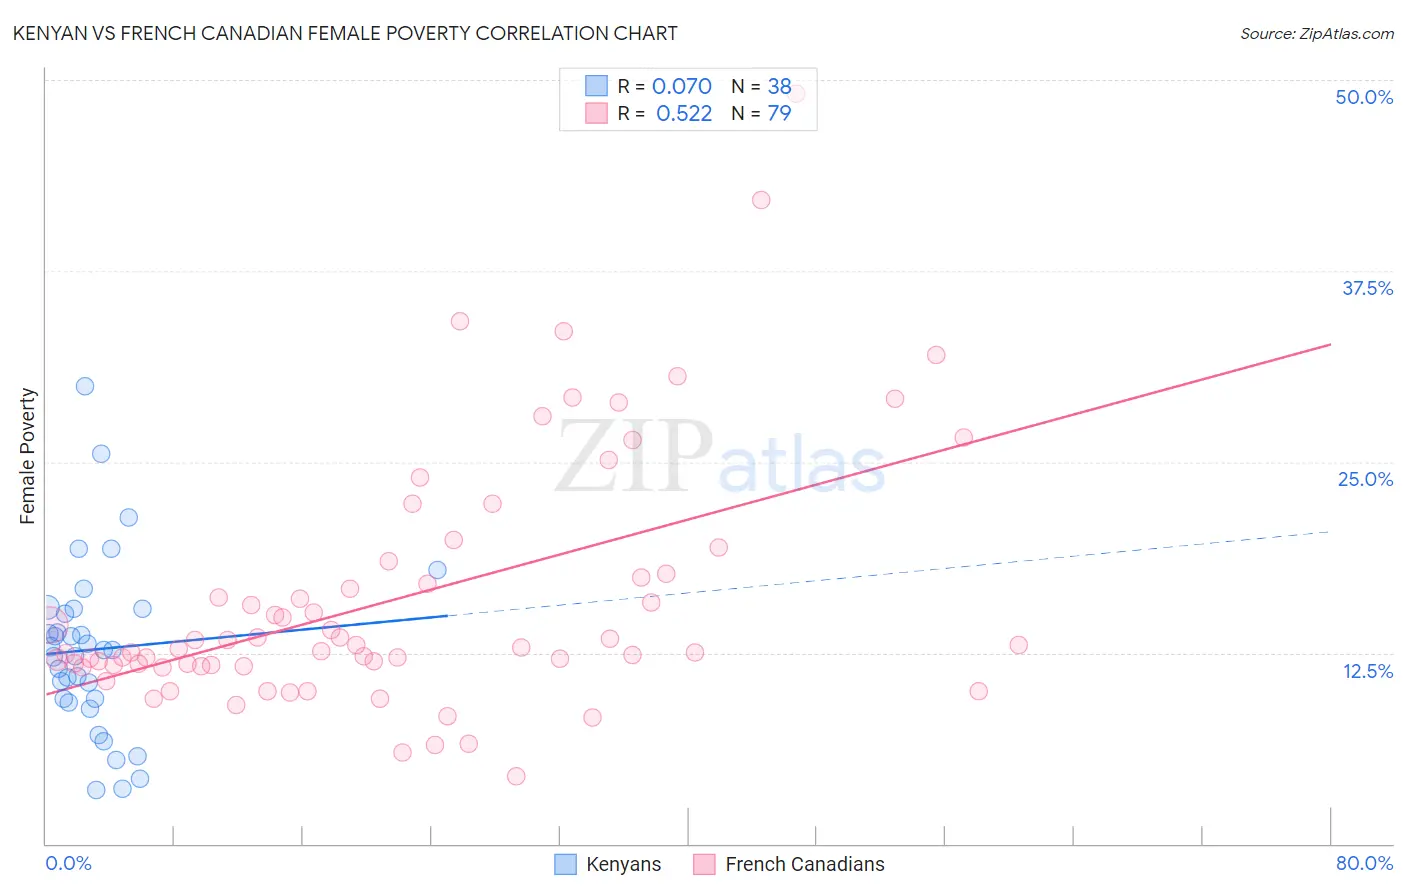
Kenyan vs French Canadian Female Poverty Correlation Chart
The statistical analysis conducted on geographies consisting of 168,133,672 people shows a slight positive correlation between the proportion of Kenyans and poverty level among females in the United States with a correlation coefficient (R) of 0.070 and weighted average of 13.5%. Similarly, the statistical analysis conducted on geographies consisting of 502,012,927 people shows a substantial positive correlation between the proportion of French Canadians and poverty level among females in the United States with a correlation coefficient (R) of 0.522 and weighted average of 12.7%, a difference of 6.3%.
Female Poverty Correlation Summary
| Measurement | Kenyan | French Canadian |
| Minimum | 3.5% | 4.4% |
| Maximum | 29.9% | 49.1% |
| Range | 26.4% | 44.7% |
| Mean | 12.7% | 16.1% |
| Median | 12.7% | 12.8% |
| Interquartile 25% (IQ1) | 9.5% | 11.7% |
| Interquartile 75% (IQ3) | 15.4% | 17.6% |
| Interquartile Range (IQR) | 5.9% | 6.0% |
| Standard Deviation (Sample) | 5.6% | 8.3% |
| Standard Deviation (Population) | 5.5% | 8.2% |
Similar Demographics by Female Poverty
Demographics Similar to Kenyans by Female Poverty
In terms of female poverty, the demographic groups most similar to Kenyans are Immigrants from Sierra Leone (13.5%, a difference of 0.060%), Venezuelan (13.5%, a difference of 0.070%), Immigrants from Colombia (13.5%, a difference of 0.070%), South American (13.5%, a difference of 0.10%), and Immigrants from Cameroon (13.5%, a difference of 0.17%).
| Demographics | Rating | Rank | Female Poverty |
| Immigrants | Spain | 49.9 /100 | #176 | Average 13.4% |
| Immigrants | Morocco | 49.4 /100 | #177 | Average 13.4% |
| Israelis | 49.1 /100 | #178 | Average 13.5% |
| Immigrants | Syria | 48.8 /100 | #179 | Average 13.5% |
| South Americans | 44.8 /100 | #180 | Average 13.5% |
| Venezuelans | 44.5 /100 | #181 | Average 13.5% |
| Immigrants | Colombia | 44.5 /100 | #182 | Average 13.5% |
| Kenyans | 43.8 /100 | #183 | Average 13.5% |
| Immigrants | Sierra Leone | 43.2 /100 | #184 | Average 13.5% |
| Immigrants | Cameroon | 42.0 /100 | #185 | Average 13.5% |
| Immigrants | Portugal | 41.5 /100 | #186 | Average 13.6% |
| Immigrants | Venezuela | 41.0 /100 | #187 | Average 13.6% |
| Hawaiians | 39.9 /100 | #188 | Fair 13.6% |
| Uruguayans | 39.8 /100 | #189 | Fair 13.6% |
| Sierra Leoneans | 33.1 /100 | #190 | Fair 13.7% |
Demographics Similar to French Canadians by Female Poverty
In terms of female poverty, the demographic groups most similar to French Canadians are Immigrants from Hungary (12.7%, a difference of 0.040%), Immigrants from South Eastern Asia (12.7%, a difference of 0.070%), New Zealander (12.7%, a difference of 0.14%), Albanian (12.7%, a difference of 0.20%), and Sri Lankan (12.7%, a difference of 0.21%).
| Demographics | Rating | Rank | Female Poverty |
| Puget Sound Salish | 91.5 /100 | #115 | Exceptional 12.7% |
| Immigrants | Russia | 91.2 /100 | #116 | Exceptional 12.7% |
| Immigrants | Southern Europe | 90.9 /100 | #117 | Exceptional 12.7% |
| Sri Lankans | 90.9 /100 | #118 | Exceptional 12.7% |
| Albanians | 90.8 /100 | #119 | Exceptional 12.7% |
| New Zealanders | 90.6 /100 | #120 | Exceptional 12.7% |
| Immigrants | Hungary | 90.3 /100 | #121 | Exceptional 12.7% |
| French Canadians | 90.2 /100 | #122 | Exceptional 12.7% |
| Immigrants | South Eastern Asia | 89.9 /100 | #123 | Excellent 12.7% |
| Immigrants | Norway | 89.3 /100 | #124 | Excellent 12.8% |
| Argentineans | 89.1 /100 | #125 | Excellent 12.8% |
| Immigrants | Ukraine | 88.8 /100 | #126 | Excellent 12.8% |
| South Africans | 88.4 /100 | #127 | Excellent 12.8% |
| Immigrants | Belarus | 88.2 /100 | #128 | Excellent 12.8% |
| Immigrants | Brazil | 87.9 /100 | #129 | Excellent 12.8% |