Barbadian vs Ugandan Female Poverty
COMPARE
Barbadian
Ugandan
Female Poverty
Female Poverty Comparison
Barbadians
Ugandans
15.9%
FEMALE POVERTY
0.0/ 100
METRIC RATING
274th/ 347
METRIC RANK
14.0%
FEMALE POVERTY
15.4/ 100
METRIC RATING
205th/ 347
METRIC RANK
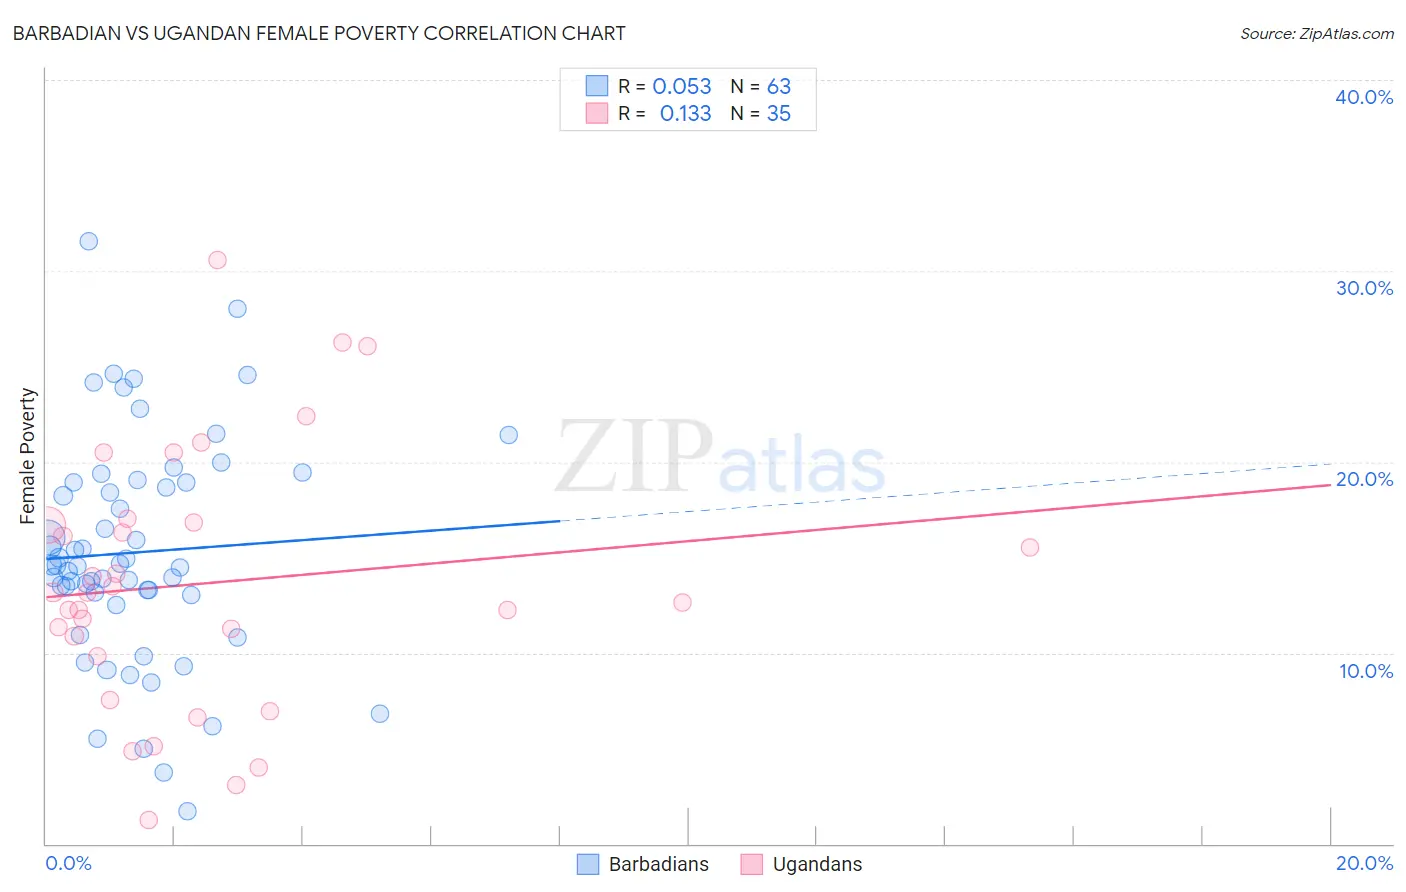
Barbadian vs Ugandan Female Poverty Correlation Chart
The statistical analysis conducted on geographies consisting of 141,263,328 people shows a slight positive correlation between the proportion of Barbadians and poverty level among females in the United States with a correlation coefficient (R) of 0.053 and weighted average of 15.9%. Similarly, the statistical analysis conducted on geographies consisting of 93,995,237 people shows a poor positive correlation between the proportion of Ugandans and poverty level among females in the United States with a correlation coefficient (R) of 0.133 and weighted average of 14.0%, a difference of 13.9%.
Female Poverty Correlation Summary
| Measurement | Barbadian | Ugandan |
| Minimum | 1.7% | 1.3% |
| Maximum | 31.5% | 30.6% |
| Range | 29.8% | 29.3% |
| Mean | 15.3% | 13.6% |
| Median | 14.6% | 13.1% |
| Interquartile 25% (IQ1) | 13.0% | 9.8% |
| Interquartile 75% (IQ3) | 18.9% | 16.8% |
| Interquartile Range (IQR) | 5.9% | 7.0% |
| Standard Deviation (Sample) | 5.8% | 6.8% |
| Standard Deviation (Population) | 5.8% | 6.7% |
Similar Demographics by Female Poverty
Demographics Similar to Barbadians by Female Poverty
In terms of female poverty, the demographic groups most similar to Barbadians are Haitian (15.9%, a difference of 0.0%), Belizean (15.9%, a difference of 0.010%), Immigrants from Barbados (16.0%, a difference of 0.070%), Central American (16.0%, a difference of 0.19%), and Immigrants from St. Vincent and the Grenadines (15.9%, a difference of 0.24%).
| Demographics | Rating | Rank | Female Poverty |
| Sub-Saharan Africans | 0.1 /100 | #267 | Tragic 15.8% |
| Immigrants | Nicaragua | 0.1 /100 | #268 | Tragic 15.8% |
| Iroquois | 0.1 /100 | #269 | Tragic 15.8% |
| Chickasaw | 0.1 /100 | #270 | Tragic 15.9% |
| Immigrants | St. Vincent and the Grenadines | 0.0 /100 | #271 | Tragic 15.9% |
| Belizeans | 0.0 /100 | #272 | Tragic 15.9% |
| Haitians | 0.0 /100 | #273 | Tragic 15.9% |
| Barbadians | 0.0 /100 | #274 | Tragic 15.9% |
| Immigrants | Barbados | 0.0 /100 | #275 | Tragic 16.0% |
| Central Americans | 0.0 /100 | #276 | Tragic 16.0% |
| Bangladeshis | 0.0 /100 | #277 | Tragic 16.0% |
| Immigrants | West Indies | 0.0 /100 | #278 | Tragic 16.1% |
| Immigrants | Bahamas | 0.0 /100 | #279 | Tragic 16.1% |
| Vietnamese | 0.0 /100 | #280 | Tragic 16.1% |
| West Indians | 0.0 /100 | #281 | Tragic 16.1% |
Demographics Similar to Ugandans by Female Poverty
In terms of female poverty, the demographic groups most similar to Ugandans are Immigrants from Uruguay (14.0%, a difference of 0.27%), Spaniard (13.9%, a difference of 0.56%), Immigrants from Western Asia (13.9%, a difference of 0.84%), Hmong (13.9%, a difference of 0.89%), and Immigrants from Kenya (13.9%, a difference of 0.90%).
| Demographics | Rating | Rank | Female Poverty |
| Immigrants | Uganda | 28.5 /100 | #198 | Fair 13.7% |
| Immigrants | Lebanon | 25.6 /100 | #199 | Fair 13.8% |
| Spanish | 21.4 /100 | #200 | Fair 13.9% |
| Immigrants | Kenya | 21.1 /100 | #201 | Fair 13.9% |
| Hmong | 21.1 /100 | #202 | Fair 13.9% |
| Immigrants | Western Asia | 20.7 /100 | #203 | Fair 13.9% |
| Spaniards | 18.9 /100 | #204 | Poor 13.9% |
| Ugandans | 15.4 /100 | #205 | Poor 14.0% |
| Immigrants | Uruguay | 14.0 /100 | #206 | Poor 14.0% |
| Immigrants | Eastern Africa | 9.0 /100 | #207 | Tragic 14.2% |
| Immigrants | Azores | 7.9 /100 | #208 | Tragic 14.2% |
| Panamanians | 7.7 /100 | #209 | Tragic 14.2% |
| Malaysians | 7.4 /100 | #210 | Tragic 14.3% |
| Moroccans | 7.2 /100 | #211 | Tragic 14.3% |
| Bermudans | 5.5 /100 | #212 | Tragic 14.4% |