Kenyan vs Immigrants from Nicaragua Seniors Poverty Over the Age of 75
COMPARE
Kenyan
Immigrants from Nicaragua
Seniors Poverty Over the Age of 75
Seniors Poverty Over the Age of 75 Comparison
Kenyans
Immigrants from Nicaragua
11.5%
SENIORS POVERTY OVER THE AGE OF 75
93.9/ 100
METRIC RATING
92nd/ 347
METRIC RANK
17.6%
SENIORS POVERTY OVER THE AGE OF 75
0.0/ 100
METRIC RATING
333rd/ 347
METRIC RANK
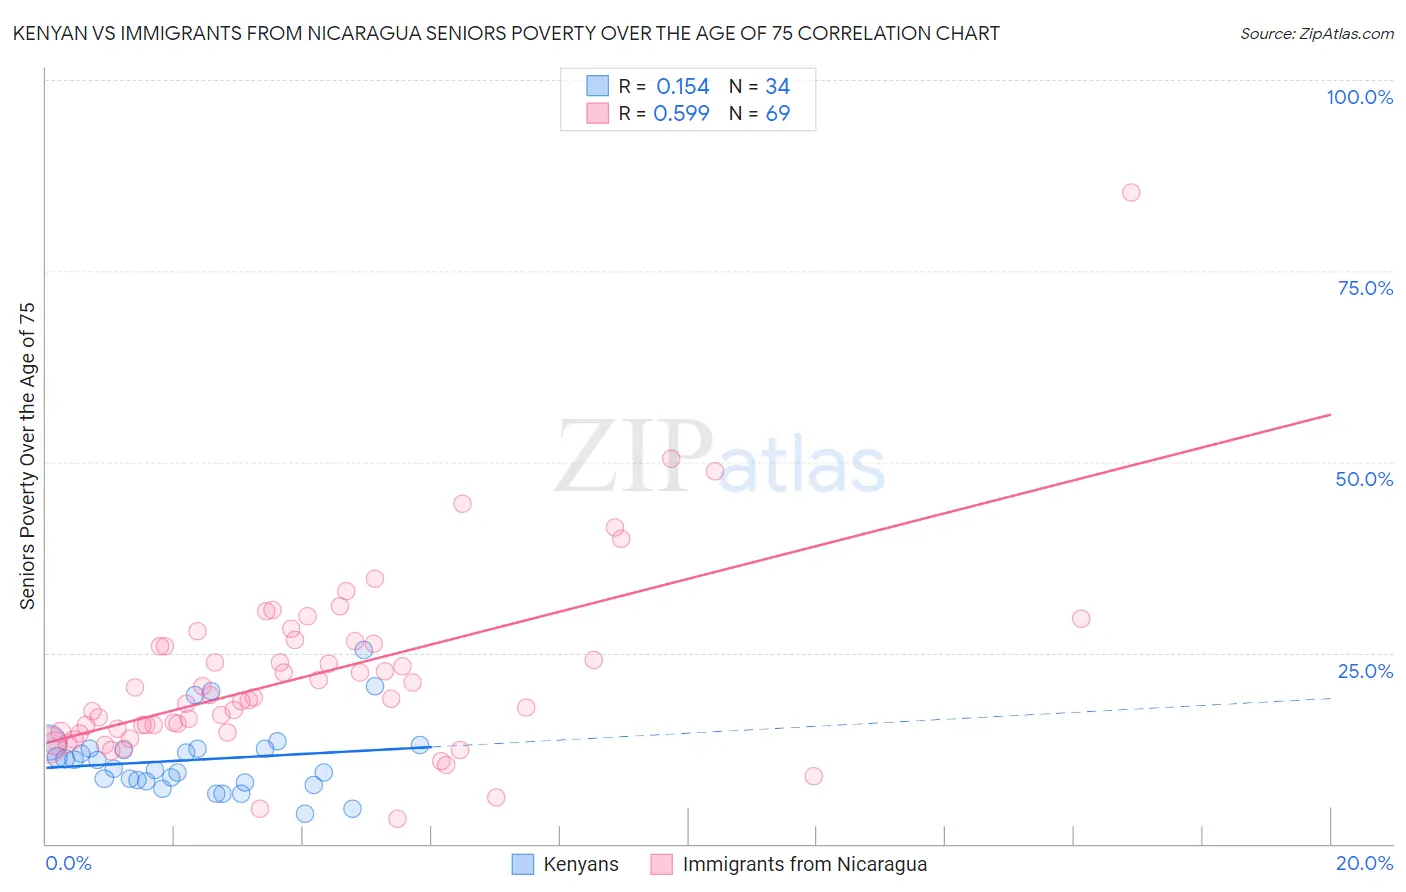
Kenyan vs Immigrants from Nicaragua Seniors Poverty Over the Age of 75 Correlation Chart
The statistical analysis conducted on geographies consisting of 167,184,352 people shows a poor positive correlation between the proportion of Kenyans and poverty level among seniors over the age of 75 in the United States with a correlation coefficient (R) of 0.154 and weighted average of 11.5%. Similarly, the statistical analysis conducted on geographies consisting of 235,301,919 people shows a substantial positive correlation between the proportion of Immigrants from Nicaragua and poverty level among seniors over the age of 75 in the United States with a correlation coefficient (R) of 0.599 and weighted average of 17.6%, a difference of 52.8%.
Seniors Poverty Over the Age of 75 Correlation Summary
| Measurement | Kenyan | Immigrants from Nicaragua |
| Minimum | 3.9% | 3.3% |
| Maximum | 25.4% | 85.2% |
| Range | 21.5% | 82.0% |
| Mean | 11.0% | 22.0% |
| Median | 10.4% | 19.0% |
| Interquartile 25% (IQ1) | 8.2% | 14.6% |
| Interquartile 75% (IQ3) | 12.4% | 26.3% |
| Interquartile Range (IQR) | 4.2% | 11.7% |
| Standard Deviation (Sample) | 4.6% | 12.3% |
| Standard Deviation (Population) | 4.5% | 12.2% |
Similar Demographics by Seniors Poverty Over the Age of 75
Demographics Similar to Kenyans by Seniors Poverty Over the Age of 75
In terms of seniors poverty over the age of 75, the demographic groups most similar to Kenyans are Immigrants from Germany (11.5%, a difference of 0.070%), Aleut (11.5%, a difference of 0.080%), Immigrants from Sri Lanka (11.5%, a difference of 0.20%), Immigrants from Croatia (11.5%, a difference of 0.23%), and Korean (11.5%, a difference of 0.25%).
| Demographics | Rating | Rank | Seniors Poverty Over the Age of 75 |
| Immigrants | Bulgaria | 94.7 /100 | #85 | Exceptional 11.5% |
| Australians | 94.6 /100 | #86 | Exceptional 11.5% |
| Koreans | 94.5 /100 | #87 | Exceptional 11.5% |
| Immigrants | Croatia | 94.5 /100 | #88 | Exceptional 11.5% |
| Immigrants | Sri Lanka | 94.4 /100 | #89 | Exceptional 11.5% |
| Aleuts | 94.1 /100 | #90 | Exceptional 11.5% |
| Immigrants | Germany | 94.1 /100 | #91 | Exceptional 11.5% |
| Kenyans | 93.9 /100 | #92 | Exceptional 11.5% |
| Immigrants | Poland | 92.9 /100 | #93 | Exceptional 11.6% |
| Creek | 92.7 /100 | #94 | Exceptional 11.6% |
| Immigrants | Bosnia and Herzegovina | 92.6 /100 | #95 | Exceptional 11.6% |
| Immigrants | Sweden | 92.6 /100 | #96 | Exceptional 11.6% |
| Romanians | 92.3 /100 | #97 | Exceptional 11.6% |
| Immigrants | Japan | 91.9 /100 | #98 | Exceptional 11.6% |
| Immigrants | Ethiopia | 91.7 /100 | #99 | Exceptional 11.6% |
Demographics Similar to Immigrants from Nicaragua by Seniors Poverty Over the Age of 75
In terms of seniors poverty over the age of 75, the demographic groups most similar to Immigrants from Nicaragua are Immigrants from St. Vincent and the Grenadines (17.5%, a difference of 0.47%), Immigrants from Armenia (17.5%, a difference of 0.74%), British West Indian (17.4%, a difference of 0.99%), Immigrants from Grenada (17.8%, a difference of 1.5%), and Cuban (18.0%, a difference of 2.1%).
| Demographics | Rating | Rank | Seniors Poverty Over the Age of 75 |
| Pueblo | 0.0 /100 | #326 | Tragic 16.7% |
| Sioux | 0.0 /100 | #327 | Tragic 16.8% |
| Cape Verdeans | 0.0 /100 | #328 | Tragic 16.8% |
| Immigrants | Dominica | 0.0 /100 | #329 | Tragic 17.0% |
| British West Indians | 0.0 /100 | #330 | Tragic 17.4% |
| Immigrants | Armenia | 0.0 /100 | #331 | Tragic 17.5% |
| Immigrants | St. Vincent and the Grenadines | 0.0 /100 | #332 | Tragic 17.5% |
| Immigrants | Nicaragua | 0.0 /100 | #333 | Tragic 17.6% |
| Immigrants | Grenada | 0.0 /100 | #334 | Tragic 17.8% |
| Cubans | 0.0 /100 | #335 | Tragic 18.0% |
| Immigrants | Caribbean | 0.0 /100 | #336 | Tragic 18.2% |
| Yakama | 0.0 /100 | #337 | Tragic 18.3% |
| Immigrants | Cabo Verde | 0.0 /100 | #338 | Tragic 18.5% |
| Hopi | 0.0 /100 | #339 | Tragic 18.9% |
| Tohono O'odham | 0.0 /100 | #340 | Tragic 19.1% |