Kenyan vs Panamanian Single Father Poverty

COMPARE

Kenyan
Race
Ancestry
AfghanAfricanAlaska NativeAlaskan AthabascanAlbanianAleutAlsatianAmericanApacheArabArapahoArgentineanArmenianAssyrian/Chaldean/SyriacAustralianAustrianBahamianBangladeshiBarbadianBasqueBelgianBelizeanBermudanBhutaneseBlackfeetBolivianBrazilianBritishBritish West IndianBulgarianBurmeseCajunCambodianCanadianCape VerdeanCarpatho RusynCelticCentral AmericanCentral American IndianCherokeeCheyenneChickasawChileanChineseChippewaChoctawColombianColvilleComancheCosta RicanCreeCreekCroatianCrowCubanCypriotCzechCzechoslovakianDanishDelawareDominicanDutchDutch West IndianEastern EuropeanEcuadorianEgyptianEnglishEstonianEthiopianEuropeanFijianFilipinoFinnishFrenchFrench American IndianFrench CanadianGermanGerman RussianGhanaianGreekGuamanian/ChamorroGuatemalanGuyaneseHaitianHmongHonduranHopiHoumaHungarianIcelanderIndian (Asian)IndonesianInupiatIranianIraqiIrishIroquoisIsraeliItalianJamaicanJapaneseJordanianKenyanKiowaKoreanLaotianLatvianLebaneseLiberianLithuanianLumbeeLuxembourgerMacedonianMalaysianMalteseMarshalleseMenomineeMexicanMexican American IndianMongolianMoroccanNative HawaiianNavajoNepaleseNew ZealanderNicaraguanNigerianNorthern EuropeanNorwegianOkinawanOsageOttawaPaiutePakistaniPalestinianParaguayanPennsylvania GermanPeruvianPimaPolishPortuguesePotawatomiPuebloPuerto RicanPuget Sound SalishRomanianRussianSalvadoranSamoanScandinavianScotch-IrishScottishSeminoleSenegaleseSerbianShoshoneSierra LeoneanSiouxSlavicSlovakSloveneSomaliSouth AfricanSouth AmericanSouth American IndianSoviet UnionSpaniardSpanishSpanish AmericanSpanish American IndianSri LankanSubsaharan AfricanSudaneseSwedishSwissSyrianTaiwaneseThaiTlingit-HaidaTohono O'OdhamTonganTrinidadian and TobagonianTsimshianTurkishU.S. Virgin IslanderUgandanUkrainianUruguayanUteVenezuelanVietnameseWelshWest IndianYakamaYaquiYugoslavianYumanYup'ikZimbabwean
Immigration
NonimmigrantsImmigrantsAfghanistanAfricaAlbaniaArgentinaArmeniaAsiaAustraliaAustriaBahamasBangladeshBarbadosBelarusBelgiumBelizeBoliviaBosnia and HerzegovinaBrazilBulgariaBurma/MyanmarCabo VerdeCambodiaCameroonCanadaCaribbeanCentral AmericaChileChinaColombiaCongoCosta RicaCroatiaCubaCzechoslovakiaDenmarkDominicaDominican RepublicEastern AfricaEastern AsiaEastern EuropeEcuadorEgyptEl SalvadorEnglandEritreaEthiopiaEuropeFijiFranceGermanyGhanaGreeceGrenadaGuatemalaGuyanaHaitiHondurasHong KongHungaryIndiaIndonesiaIranIraqIrelandIsraelItalyJamaicaJapanJordanKazakhstanKenyaKoreaKuwaitLaosLatin AmericaLatviaLebanonLiberiaLithuaniaMalaysiaMexicoMicronesiaMiddle AfricaMoldovaMoroccoNepalNetherlandsNicaraguaNigeriaNorth AmericaNorth MacedoniaNorthern AfricaNorthern EuropeNorwayOceaniaPakistanPanamaPeruPhilippinesPolandPortugalRomaniaRussiaSaudi ArabiaScotlandSenegalSerbiaSierra LeoneSingaporeSomaliaSouth AfricaSouth AmericaSouth Central AsiaSouth Eastern AsiaSouthern EuropeSpainSri LankaSt. Vincent and the GrenadinesSudanSwedenSwitzerlandSyriaTaiwanThailandTrinidad and TobagoTurkeyUgandaUkraineUruguayUzbekistanVenezuelaVietnamWest IndiesWestern AfricaWestern AsiaWestern EuropeYemenZaireZimbabweAzores
Panamanian
Race
Ancestry
AfghanAfricanAlaska NativeAlaskan AthabascanAlbanianAleutAlsatianAmericanApacheArabArapahoArgentineanArmenianAssyrian/Chaldean/SyriacAustralianAustrianBahamianBangladeshiBarbadianBasqueBelgianBelizeanBermudanBhutaneseBlackfeetBolivianBrazilianBritishBritish West IndianBulgarianBurmeseCajunCambodianCanadianCape VerdeanCarpatho RusynCelticCentral AmericanCentral American IndianCherokeeCheyenneChickasawChileanChineseChippewaChoctawColombianColvilleComancheCosta RicanCreeCreekCroatianCrowCubanCypriotCzechCzechoslovakianDanishDelawareDominicanDutchDutch West IndianEastern EuropeanEcuadorianEgyptianEnglishEstonianEthiopianEuropeanFijianFilipinoFinnishFrenchFrench American IndianFrench CanadianGermanGerman RussianGhanaianGreekGuamanian/ChamorroGuatemalanGuyaneseHaitianHmongHonduranHopiHoumaHungarianIcelanderIndian (Asian)IndonesianInupiatIranianIraqiIrishIroquoisIsraeliItalianJamaicanJapaneseJordanianKiowaKoreanLaotianLatvianLebaneseLiberianLithuanianLumbeeLuxembourgerMacedonianMalaysianMalteseMarshalleseMenomineeMexicanMexican American IndianMongolianMoroccanNative HawaiianNavajoNepaleseNew ZealanderNicaraguanNigerianNorthern EuropeanNorwegianOkinawanOsageOttawaPaiutePakistaniPalestinianPanamanianParaguayanPennsylvania GermanPeruvianPimaPolishPortuguesePotawatomiPuebloPuerto RicanPuget Sound SalishRomanianRussianSalvadoranSamoanScandinavianScotch-IrishScottishSeminoleSenegaleseSerbianShoshoneSierra LeoneanSiouxSlavicSlovakSloveneSomaliSouth AfricanSouth AmericanSouth American IndianSoviet UnionSpaniardSpanishSpanish AmericanSpanish American IndianSri LankanSubsaharan AfricanSudaneseSwedishSwissSyrianTaiwaneseThaiTlingit-HaidaTohono O'OdhamTonganTrinidadian and TobagonianTsimshianTurkishU.S. Virgin IslanderUgandanUkrainianUruguayanUteVenezuelanVietnameseWelshWest IndianYakamaYaquiYugoslavianYumanYup'ikZimbabwean
Immigration
NonimmigrantsImmigrantsAfghanistanAfricaAlbaniaArgentinaArmeniaAsiaAustraliaAustriaBahamasBangladeshBarbadosBelarusBelgiumBelizeBoliviaBosnia and HerzegovinaBrazilBulgariaBurma/MyanmarCabo VerdeCambodiaCameroonCanadaCaribbeanCentral AmericaChileChinaColombiaCongoCosta RicaCroatiaCubaCzechoslovakiaDenmarkDominicaDominican RepublicEastern AfricaEastern AsiaEastern EuropeEcuadorEgyptEl SalvadorEnglandEritreaEthiopiaEuropeFijiFranceGermanyGhanaGreeceGrenadaGuatemalaGuyanaHaitiHondurasHong KongHungaryIndiaIndonesiaIranIraqIrelandIsraelItalyJamaicaJapanJordanKazakhstanKenyaKoreaKuwaitLaosLatin AmericaLatviaLebanonLiberiaLithuaniaMalaysiaMexicoMicronesiaMiddle AfricaMoldovaMoroccoNepalNetherlandsNicaraguaNigeriaNorth AmericaNorth MacedoniaNorthern AfricaNorthern EuropeNorwayOceaniaPakistanPanamaPeruPhilippinesPolandPortugalRomaniaRussiaSaudi ArabiaScotlandSenegalSerbiaSierra LeoneSingaporeSomaliaSouth AfricaSouth AmericaSouth Central AsiaSouth Eastern AsiaSouthern EuropeSpainSri LankaSt. Vincent and the GrenadinesSudanSwedenSwitzerlandSyriaTaiwanThailandTrinidad and TobagoTurkeyUgandaUkraineUruguayUzbekistanVenezuelaVietnamWest IndiesWestern AfricaWestern AsiaWestern EuropeYemenZaireZimbabweAzores
Single Father Poverty
Income
Poverty
Unemployment
Labor Participation
Family Structure
Vehicle Availability
Education Level
Disability

Single Father Poverty Comparison

Kenyans

Panamanians

Exceptional
Fair
15.3%
SINGLE FATHER POVERTY
99.6/ 100
METRIC RATING
73rd/ 347
METRIC RANK
16.4%
SINGLE FATHER POVERTY
33.6/ 100
METRIC RATING
185th/ 347
METRIC RANK

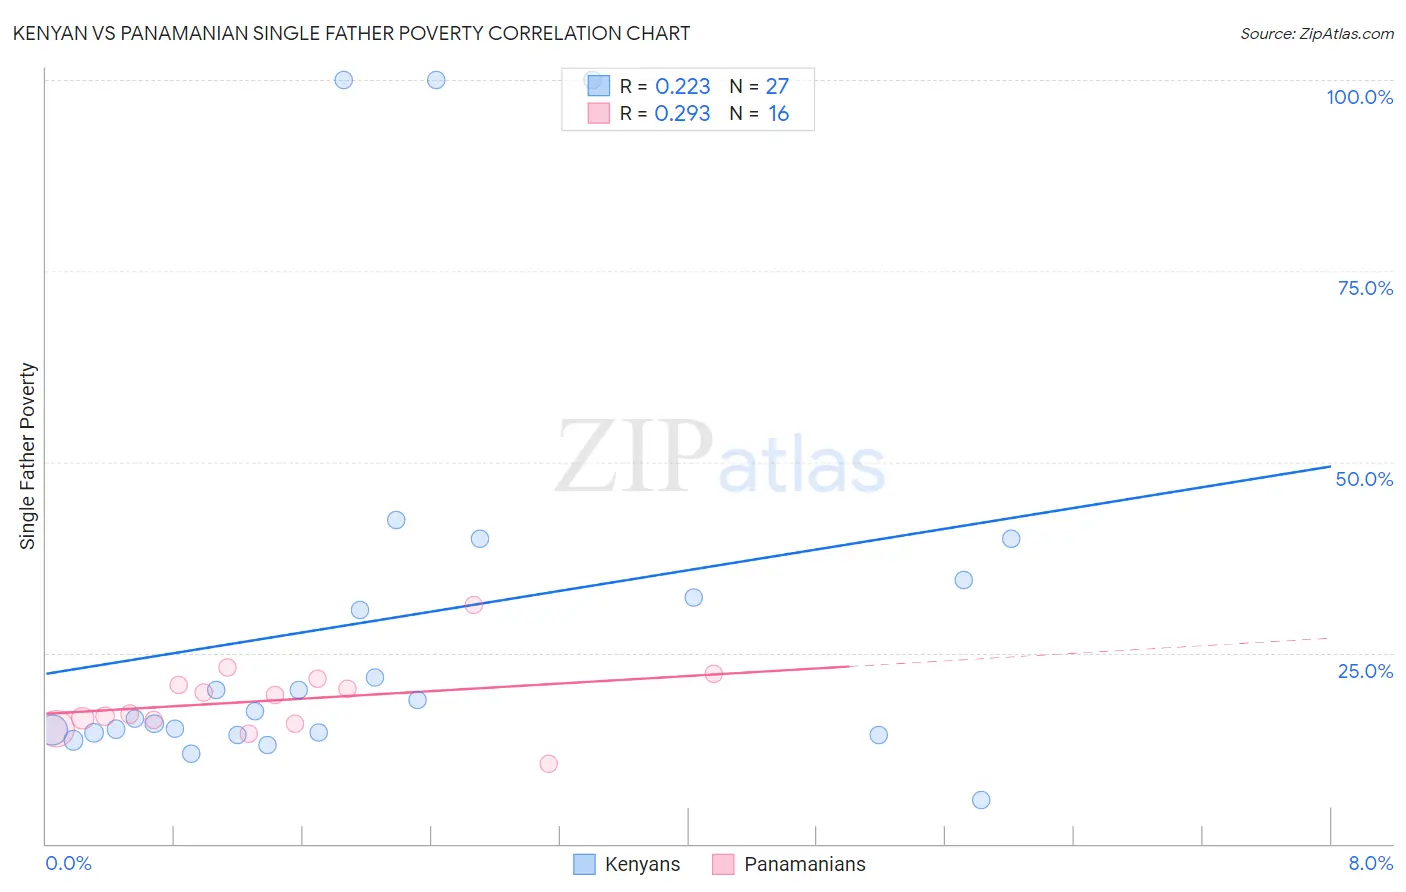
Kenyan vs Panamanian Single Father Poverty Correlation Chart

The statistical analysis conducted on geographies consisting of 147,839,292 people shows a weak positive correlation between the proportion of Kenyans and poverty level among single fathers in the United States with a correlation coefficient (R) of 0.223 and weighted average of 15.3%. Similarly, the statistical analysis conducted on geographies consisting of 236,933,167 people shows a weak positive correlation between the proportion of Panamanians and poverty level among single fathers in the United States with a correlation coefficient (R) of 0.293 and weighted average of 16.4%, a difference of 7.2%.
Kenyan vs Panamanian Single Father Poverty

Single Father Poverty Correlation Summary

MeasurementKenyanPanamanian
Minimum5.7%10.4%
Maximum100.0%31.2%
Range94.3%20.8%
Mean29.5%18.8%
Median17.3%18.2%
Interquartile 25% (IQ1)14.6%15.9%
Interquartile 75% (IQ3)34.6%21.2%
Interquartile Range (IQR)20.0%5.3%
Standard Deviation (Sample)27.1%4.7%
Standard Deviation (Population)26.6%4.6%

Similar Demographics by Single Father Poverty

Demographics Similar to Kenyans by Single Father Poverty

In terms of single father poverty, the demographic groups most similar to Kenyans are Maltese (15.3%, a difference of 0.040%), Immigrants from Turkey (15.3%, a difference of 0.060%), Immigrants from Lithuania (15.3%, a difference of 0.090%), Immigrants from Japan (15.3%, a difference of 0.14%), and Immigrants from Peru (15.3%, a difference of 0.15%).
DemographicsRating | RankSingle Father Poverty
Immigrants | Moldova
99.8
/100
|
#66
Exceptional
15.2%
Paraguayans
99.7
/100
|
#67
Exceptional
15.2%
Immigrants | Cameroon
99.7
/100
|
#68
Exceptional
15.2%
Japanese
99.7
/100
|
#69
Exceptional
15.2%
Mongolians
99.7
/100
|
#70
Exceptional
15.3%
Immigrants | Brazil
99.6
/100
|
#71
Exceptional
15.3%
Immigrants | Lithuania
99.6
/100
|
#72
Exceptional
15.3%
Kenyans
99.6
/100
|
#73
Exceptional
15.3%
Maltese
99.6
/100
|
#74
Exceptional
15.3%
Immigrants | Turkey
99.5
/100
|
#75
Exceptional
15.3%
Immigrants | Japan
99.5
/100
|
#76
Exceptional
15.3%
Immigrants | Peru
99.5
/100
|
#77
Exceptional
15.3%
Tlingit-Haida
99.5
/100
|
#78
Exceptional
15.3%
Immigrants | Northern Africa
99.5
/100
|
#79
Exceptional
15.3%
Armenians
99.4
/100
|
#80
Exceptional
15.4%

Demographics Similar to Panamanians by Single Father Poverty

In terms of single father poverty, the demographic groups most similar to Panamanians are Cambodian (16.4%, a difference of 0.050%), Aleut (16.4%, a difference of 0.080%), Immigrants from Italy (16.4%, a difference of 0.11%), Immigrants from Western Africa (16.4%, a difference of 0.12%), and Immigrants from Venezuela (16.4%, a difference of 0.13%).
DemographicsRating | RankSingle Father Poverty
Immigrants | Cuba
41.6
/100
|
#178
Average
16.4%
Serbians
40.9
/100
|
#179
Average
16.4%
Immigrants | Latin America
37.2
/100
|
#180
Fair
16.4%
Immigrants | Western Africa
36.0
/100
|
#181
Fair
16.4%
Immigrants | Italy
35.7
/100
|
#182
Fair
16.4%
Aleuts
35.3
/100
|
#183
Fair
16.4%
Cambodians
34.6
/100
|
#184
Fair
16.4%
Panamanians
33.6
/100
|
#185
Fair
16.4%
Immigrants | Venezuela
31.0
/100
|
#186
Fair
16.4%
Ukrainians
30.4
/100
|
#187
Fair
16.4%
Russians
30.1
/100
|
#188
Fair
16.4%
Latvians
28.9
/100
|
#189
Fair
16.5%
Immigrants | Burma/Myanmar
28.0
/100
|
#190
Fair
16.5%
Immigrants | Guyana
27.1
/100
|
#191
Fair
16.5%
Immigrants | Switzerland
24.8
/100
|
#192
Fair
16.5%