Kenyan vs Immigrants from Uzbekistan Single Father Poverty
COMPARE
Kenyan
Immigrants from Uzbekistan
Single Father Poverty
Single Father Poverty Comparison
Kenyans
Immigrants from Uzbekistan
15.3%
SINGLE FATHER POVERTY
99.6/ 100
METRIC RATING
73rd/ 347
METRIC RANK
15.0%
SINGLE FATHER POVERTY
99.9/ 100
METRIC RATING
54th/ 347
METRIC RANK
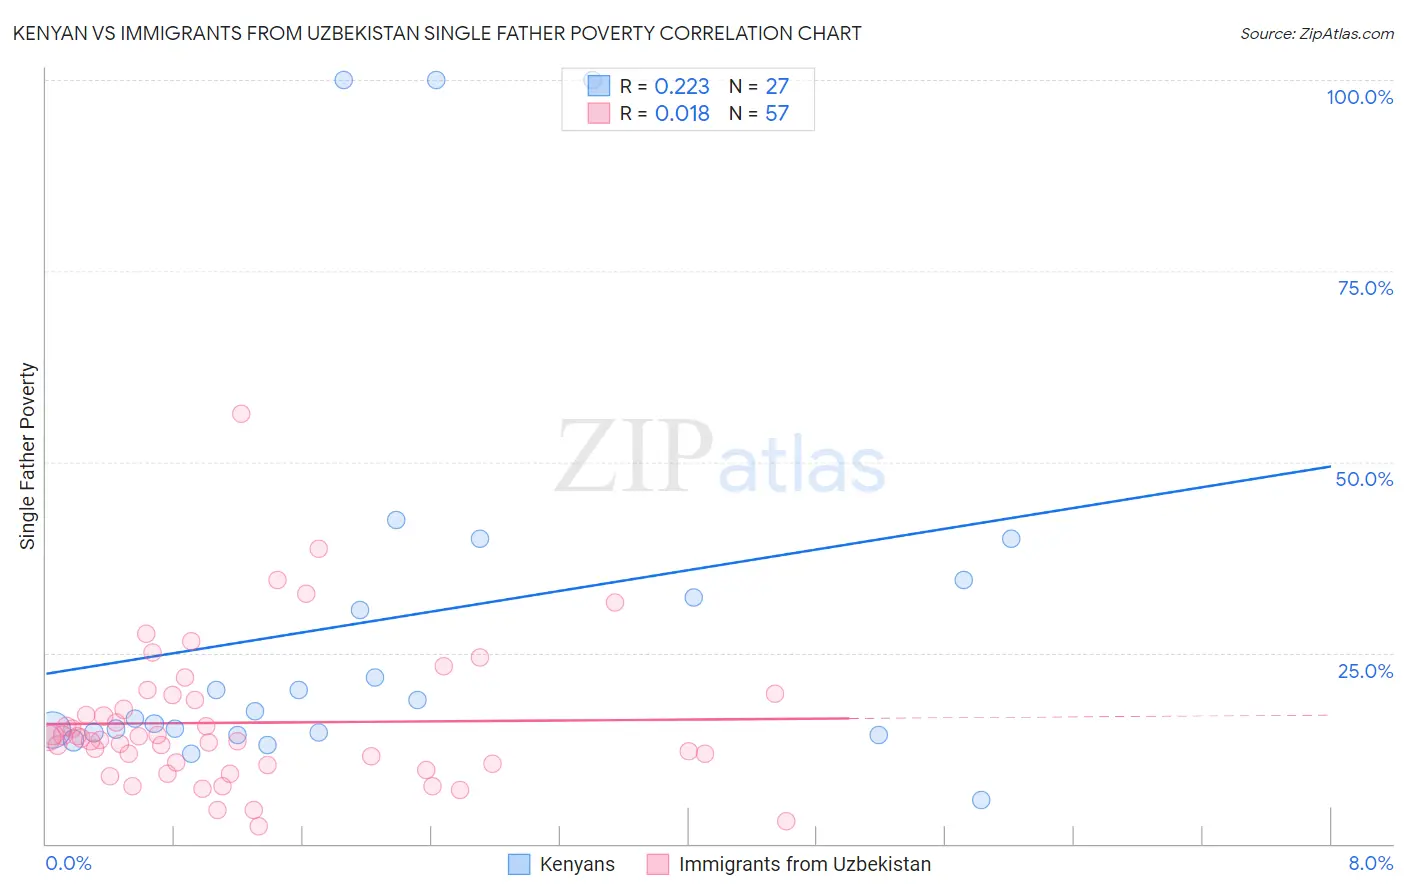
Kenyan vs Immigrants from Uzbekistan Single Father Poverty Correlation Chart
The statistical analysis conducted on geographies consisting of 147,839,292 people shows a weak positive correlation between the proportion of Kenyans and poverty level among single fathers in the United States with a correlation coefficient (R) of 0.223 and weighted average of 15.3%. Similarly, the statistical analysis conducted on geographies consisting of 104,243,458 people shows no correlation between the proportion of Immigrants from Uzbekistan and poverty level among single fathers in the United States with a correlation coefficient (R) of 0.018 and weighted average of 15.0%, a difference of 2.1%.
Single Father Poverty Correlation Summary
| Measurement | Kenyan | Immigrants from Uzbekistan |
| Minimum | 5.7% | 2.4% |
| Maximum | 100.0% | 56.2% |
| Range | 94.3% | 53.9% |
| Mean | 29.5% | 15.8% |
| Median | 17.3% | 13.8% |
| Interquartile 25% (IQ1) | 14.6% | 10.4% |
| Interquartile 75% (IQ3) | 34.6% | 19.1% |
| Interquartile Range (IQR) | 20.0% | 8.7% |
| Standard Deviation (Sample) | 27.1% | 9.4% |
| Standard Deviation (Population) | 26.6% | 9.3% |
Demographics Similar to Kenyans and Immigrants from Uzbekistan by Single Father Poverty
In terms of single father poverty, the demographic groups most similar to Kenyans are Immigrants from Lithuania (15.3%, a difference of 0.090%), Immigrants from Brazil (15.3%, a difference of 0.21%), Mongolian (15.3%, a difference of 0.42%), Japanese (15.2%, a difference of 0.53%), and Immigrants from Cameroon (15.2%, a difference of 0.55%). Similarly, the demographic groups most similar to Immigrants from Uzbekistan are Immigrants from Bulgaria (15.0%, a difference of 0.050%), Immigrants from Kenya (15.0%, a difference of 0.18%), Immigrants from Laos (15.1%, a difference of 0.32%), Laotian (15.1%, a difference of 0.41%), and Hawaiian (15.1%, a difference of 0.47%).
| Demographics | Rating | Rank | Single Father Poverty |
| Immigrants | Kenya | 99.9 /100 | #53 | Exceptional 15.0% |
| Immigrants | Uzbekistan | 99.9 /100 | #54 | Exceptional 15.0% |
| Immigrants | Bulgaria | 99.9 /100 | #55 | Exceptional 15.0% |
| Immigrants | Laos | 99.9 /100 | #56 | Exceptional 15.1% |
| Laotians | 99.9 /100 | #57 | Exceptional 15.1% |
| Hawaiians | 99.9 /100 | #58 | Exceptional 15.1% |
| Guamanians/Chamorros | 99.9 /100 | #59 | Exceptional 15.1% |
| Puget Sound Salish | 99.8 /100 | #60 | Exceptional 15.2% |
| Immigrants | Bosnia and Herzegovina | 99.8 /100 | #61 | Exceptional 15.2% |
| Immigrants | Armenia | 99.8 /100 | #62 | Exceptional 15.2% |
| Immigrants | Sweden | 99.8 /100 | #63 | Exceptional 15.2% |
| Bangladeshis | 99.8 /100 | #64 | Exceptional 15.2% |
| Immigrants | Malaysia | 99.8 /100 | #65 | Exceptional 15.2% |
| Immigrants | Moldova | 99.8 /100 | #66 | Exceptional 15.2% |
| Paraguayans | 99.7 /100 | #67 | Exceptional 15.2% |
| Immigrants | Cameroon | 99.7 /100 | #68 | Exceptional 15.2% |
| Japanese | 99.7 /100 | #69 | Exceptional 15.2% |
| Mongolians | 99.7 /100 | #70 | Exceptional 15.3% |
| Immigrants | Brazil | 99.6 /100 | #71 | Exceptional 15.3% |
| Immigrants | Lithuania | 99.6 /100 | #72 | Exceptional 15.3% |
| Kenyans | 99.6 /100 | #73 | Exceptional 15.3% |