Kenyan vs Nepalese Single Father Poverty
COMPARE
Kenyan
Nepalese
Single Father Poverty
Single Father Poverty Comparison
Kenyans
Nepalese
15.3%
SINGLE FATHER POVERTY
99.6/ 100
METRIC RATING
73rd/ 347
METRIC RANK
14.4%
SINGLE FATHER POVERTY
100.0/ 100
METRIC RATING
27th/ 347
METRIC RANK
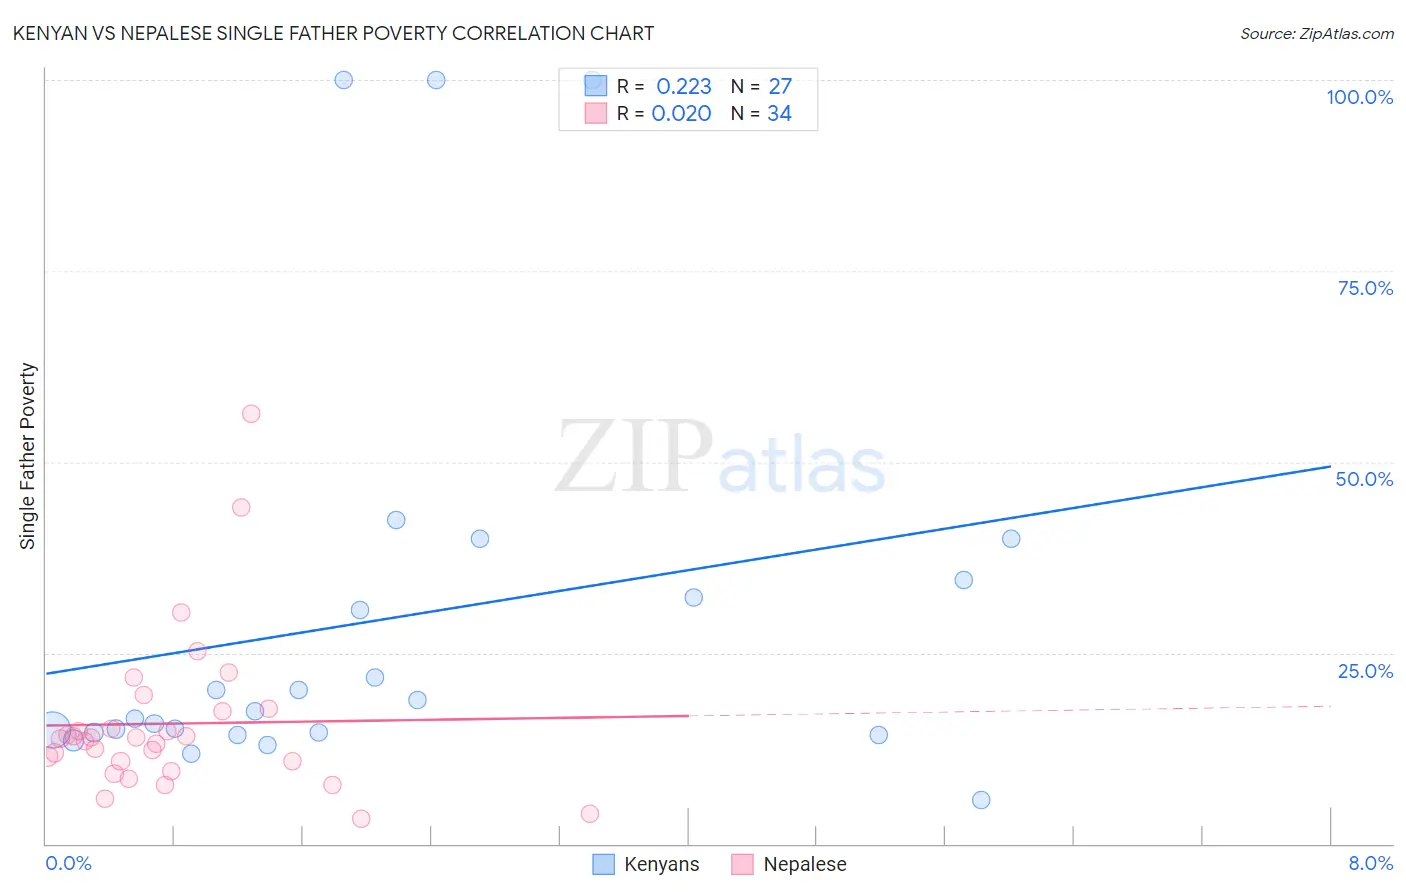
Kenyan vs Nepalese Single Father Poverty Correlation Chart
The statistical analysis conducted on geographies consisting of 147,839,292 people shows a weak positive correlation between the proportion of Kenyans and poverty level among single fathers in the United States with a correlation coefficient (R) of 0.223 and weighted average of 15.3%. Similarly, the statistical analysis conducted on geographies consisting of 23,366,556 people shows no correlation between the proportion of Nepalese and poverty level among single fathers in the United States with a correlation coefficient (R) of 0.020 and weighted average of 14.4%, a difference of 6.2%.
Single Father Poverty Correlation Summary
| Measurement | Kenyan | Nepalese |
| Minimum | 5.7% | 3.3% |
| Maximum | 100.0% | 56.2% |
| Range | 94.3% | 52.9% |
| Mean | 29.5% | 15.7% |
| Median | 17.3% | 13.8% |
| Interquartile 25% (IQ1) | 14.6% | 10.8% |
| Interquartile 75% (IQ3) | 34.6% | 17.3% |
| Interquartile Range (IQR) | 20.0% | 6.5% |
| Standard Deviation (Sample) | 27.1% | 10.5% |
| Standard Deviation (Population) | 26.6% | 10.3% |
Similar Demographics by Single Father Poverty
Demographics Similar to Kenyans by Single Father Poverty
In terms of single father poverty, the demographic groups most similar to Kenyans are Maltese (15.3%, a difference of 0.040%), Immigrants from Turkey (15.3%, a difference of 0.060%), Immigrants from Lithuania (15.3%, a difference of 0.090%), Immigrants from Japan (15.3%, a difference of 0.14%), and Immigrants from Peru (15.3%, a difference of 0.15%).
| Demographics | Rating | Rank | Single Father Poverty |
| Immigrants | Moldova | 99.8 /100 | #66 | Exceptional 15.2% |
| Paraguayans | 99.7 /100 | #67 | Exceptional 15.2% |
| Immigrants | Cameroon | 99.7 /100 | #68 | Exceptional 15.2% |
| Japanese | 99.7 /100 | #69 | Exceptional 15.2% |
| Mongolians | 99.7 /100 | #70 | Exceptional 15.3% |
| Immigrants | Brazil | 99.6 /100 | #71 | Exceptional 15.3% |
| Immigrants | Lithuania | 99.6 /100 | #72 | Exceptional 15.3% |
| Kenyans | 99.6 /100 | #73 | Exceptional 15.3% |
| Maltese | 99.6 /100 | #74 | Exceptional 15.3% |
| Immigrants | Turkey | 99.5 /100 | #75 | Exceptional 15.3% |
| Immigrants | Japan | 99.5 /100 | #76 | Exceptional 15.3% |
| Immigrants | Peru | 99.5 /100 | #77 | Exceptional 15.3% |
| Tlingit-Haida | 99.5 /100 | #78 | Exceptional 15.3% |
| Immigrants | Northern Africa | 99.5 /100 | #79 | Exceptional 15.3% |
| Armenians | 99.4 /100 | #80 | Exceptional 15.4% |
Demographics Similar to Nepalese by Single Father Poverty
In terms of single father poverty, the demographic groups most similar to Nepalese are Spanish American Indian (14.4%, a difference of 0.050%), Iranian (14.4%, a difference of 0.48%), Immigrants from South Eastern Asia (14.4%, a difference of 0.51%), Immigrants from Egypt (14.4%, a difference of 0.52%), and Immigrants from South Central Asia (14.5%, a difference of 0.53%).
| Demographics | Rating | Rank | Single Father Poverty |
| Immigrants | Singapore | 100.0 /100 | #20 | Exceptional 14.3% |
| Immigrants | Afghanistan | 100.0 /100 | #21 | Exceptional 14.3% |
| Taiwanese | 100.0 /100 | #22 | Exceptional 14.3% |
| Immigrants | Egypt | 100.0 /100 | #23 | Exceptional 14.4% |
| Immigrants | South Eastern Asia | 100.0 /100 | #24 | Exceptional 14.4% |
| Iranians | 100.0 /100 | #25 | Exceptional 14.4% |
| Spanish American Indians | 100.0 /100 | #26 | Exceptional 14.4% |
| Nepalese | 100.0 /100 | #27 | Exceptional 14.4% |
| Immigrants | South Central Asia | 100.0 /100 | #28 | Exceptional 14.5% |
| Somalis | 100.0 /100 | #29 | Exceptional 14.5% |
| Thais | 100.0 /100 | #30 | Exceptional 14.5% |
| Icelanders | 100.0 /100 | #31 | Exceptional 14.5% |
| Asians | 100.0 /100 | #32 | Exceptional 14.6% |
| Okinawans | 100.0 /100 | #33 | Exceptional 14.6% |
| Egyptians | 100.0 /100 | #34 | Exceptional 14.7% |