Kenyan vs Immigrants from Austria Disability Age 18 to 34
COMPARE
Kenyan
Immigrants from Austria
Disability Age 18 to 34
Disability Age 18 to 34 Comparison
Kenyans
Immigrants from Austria
6.8%
DISABILITY AGE 18 TO 34
18.3/ 100
METRIC RATING
199th/ 347
METRIC RANK
6.6%
DISABILITY AGE 18 TO 34
39.6/ 100
METRIC RATING
180th/ 347
METRIC RANK
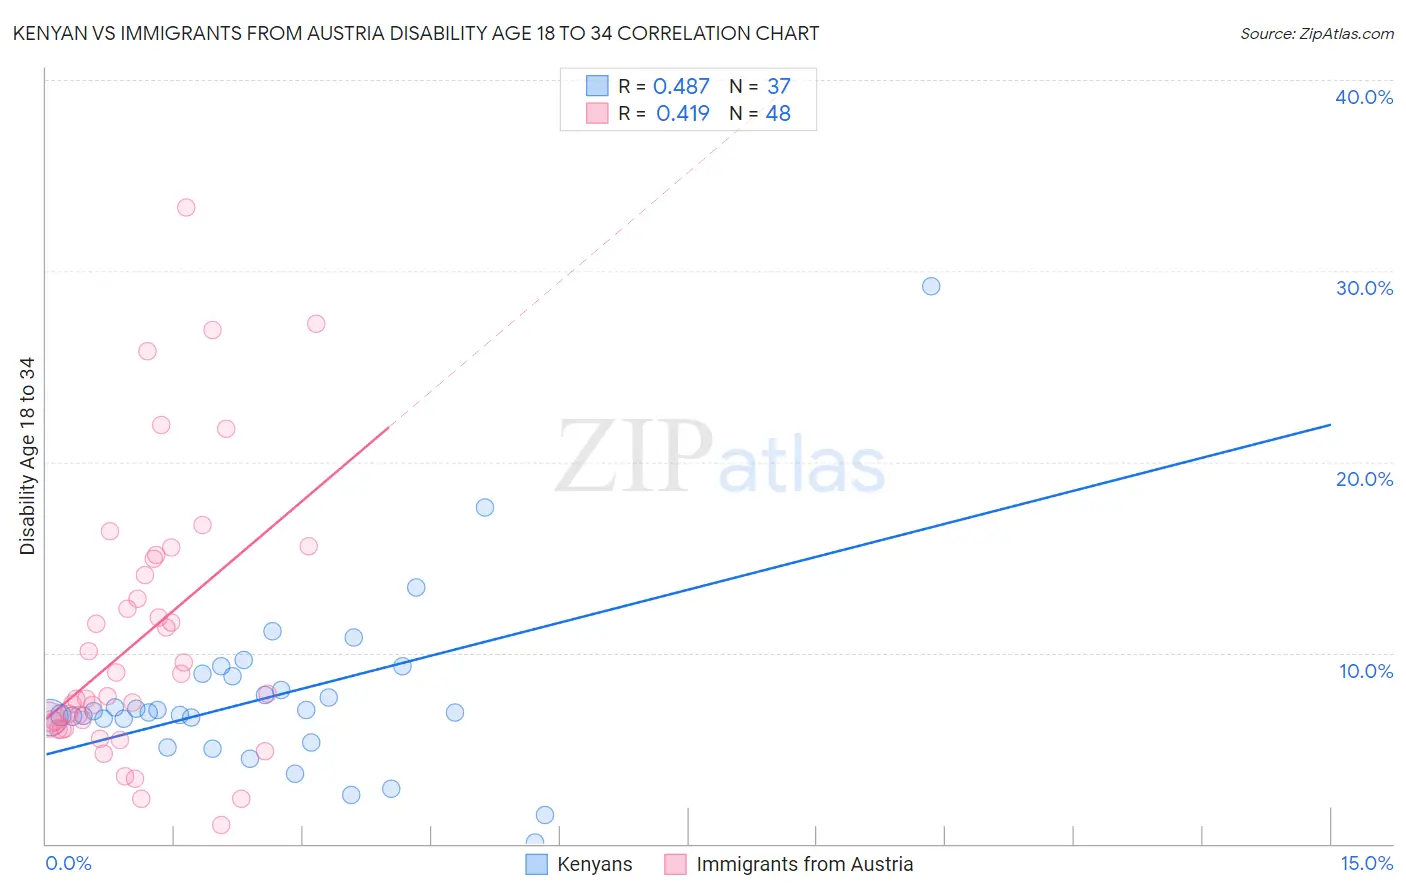
Kenyan vs Immigrants from Austria Disability Age 18 to 34 Correlation Chart
The statistical analysis conducted on geographies consisting of 168,169,697 people shows a moderate positive correlation between the proportion of Kenyans and percentage of population with a disability between the ages 18 and 35 in the United States with a correlation coefficient (R) of 0.487 and weighted average of 6.8%. Similarly, the statistical analysis conducted on geographies consisting of 167,737,581 people shows a moderate positive correlation between the proportion of Immigrants from Austria and percentage of population with a disability between the ages 18 and 35 in the United States with a correlation coefficient (R) of 0.419 and weighted average of 6.6%, a difference of 1.8%.
Disability Age 18 to 34 Correlation Summary
| Measurement | Kenyan | Immigrants from Austria |
| Minimum | 0.064% | 0.96% |
| Maximum | 29.2% | 33.3% |
| Range | 29.2% | 32.4% |
| Mean | 7.7% | 10.8% |
| Median | 6.9% | 7.8% |
| Interquartile 25% (IQ1) | 5.9% | 6.2% |
| Interquartile 75% (IQ3) | 8.8% | 14.5% |
| Interquartile Range (IQR) | 2.9% | 8.3% |
| Standard Deviation (Sample) | 4.8% | 7.2% |
| Standard Deviation (Population) | 4.7% | 7.1% |
Demographics Similar to Kenyans and Immigrants from Austria by Disability Age 18 to 34
In terms of disability age 18 to 34, the demographic groups most similar to Kenyans are Australian (6.8%, a difference of 0.13%), Estonian (6.8%, a difference of 0.25%), Immigrants from Netherlands (6.7%, a difference of 0.29%), Mexican American Indian (6.7%, a difference of 0.42%), and Immigrants from Sudan (6.7%, a difference of 0.67%). Similarly, the demographic groups most similar to Immigrants from Austria are Romanian (6.6%, a difference of 0.010%), U.S. Virgin Islander (6.7%, a difference of 0.070%), Immigrants from Iraq (6.7%, a difference of 0.16%), Iraqi (6.7%, a difference of 0.16%), and Immigrants from Ghana (6.6%, a difference of 0.18%).
| Demographics | Rating | Rank | Disability Age 18 to 34 |
| Immigrants | Ghana | 42.1 /100 | #179 | Average 6.6% |
| Immigrants | Austria | 39.6 /100 | #180 | Fair 6.6% |
| Romanians | 39.5 /100 | #181 | Fair 6.6% |
| U.S. Virgin Islanders | 38.6 /100 | #182 | Fair 6.7% |
| Immigrants | Iraq | 37.4 /100 | #183 | Fair 6.7% |
| Iraqis | 37.4 /100 | #184 | Fair 6.7% |
| Immigrants | Oceania | 35.4 /100 | #185 | Fair 6.7% |
| Yup'ik | 35.3 /100 | #186 | Fair 6.7% |
| Maltese | 34.8 /100 | #187 | Fair 6.7% |
| Immigrants | Cameroon | 34.5 /100 | #188 | Fair 6.7% |
| Pakistanis | 33.7 /100 | #189 | Fair 6.7% |
| Immigrants | Zimbabwe | 33.6 /100 | #190 | Fair 6.7% |
| Immigrants | Eastern Africa | 33.2 /100 | #191 | Fair 6.7% |
| Immigrants | Western Africa | 28.3 /100 | #192 | Fair 6.7% |
| Immigrants | Uganda | 25.1 /100 | #193 | Fair 6.7% |
| Immigrants | Sudan | 24.9 /100 | #194 | Fair 6.7% |
| Mexican American Indians | 22.3 /100 | #195 | Fair 6.7% |
| Immigrants | Netherlands | 21.0 /100 | #196 | Fair 6.7% |
| Estonians | 20.6 /100 | #197 | Fair 6.8% |
| Australians | 19.4 /100 | #198 | Poor 6.8% |
| Kenyans | 18.3 /100 | #199 | Poor 6.8% |