Jordanian vs Tsimshian Family Poverty
COMPARE
Jordanian
Tsimshian
Family Poverty
Family Poverty Comparison
Jordanians
Tsimshian
8.2%
FAMILY POVERTY
94.8/ 100
METRIC RATING
109th/ 347
METRIC RANK
8.8%
FAMILY POVERTY
69.3/ 100
METRIC RATING
157th/ 347
METRIC RANK
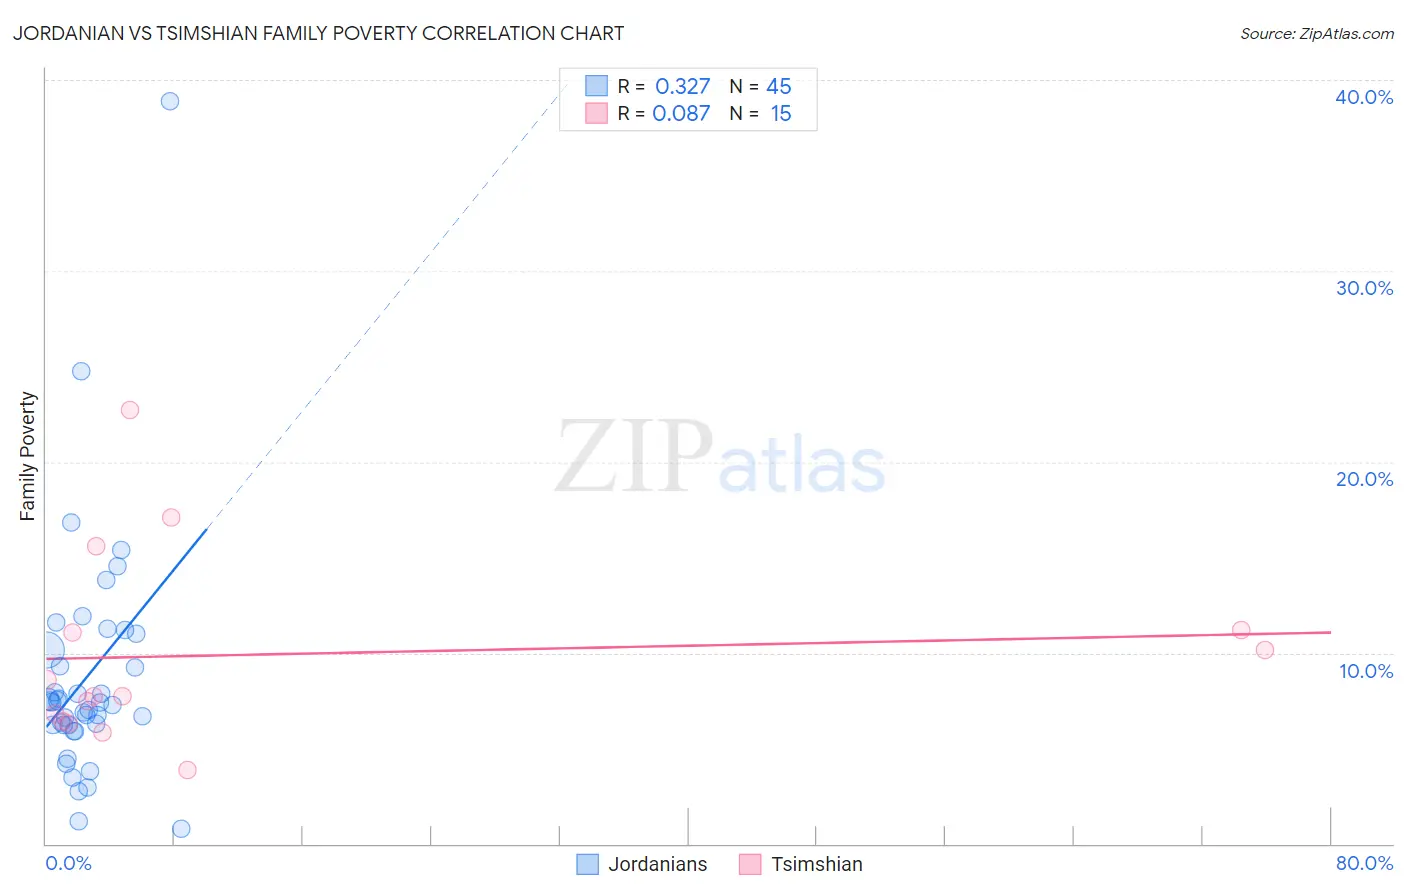
Jordanian vs Tsimshian Family Poverty Correlation Chart
The statistical analysis conducted on geographies consisting of 166,331,422 people shows a mild positive correlation between the proportion of Jordanians and poverty level among families in the United States with a correlation coefficient (R) of 0.327 and weighted average of 8.2%. Similarly, the statistical analysis conducted on geographies consisting of 15,624,889 people shows a slight positive correlation between the proportion of Tsimshian and poverty level among families in the United States with a correlation coefficient (R) of 0.087 and weighted average of 8.8%, a difference of 7.5%.
Family Poverty Correlation Summary
| Measurement | Jordanian | Tsimshian |
| Minimum | 0.81% | 3.9% |
| Maximum | 38.9% | 22.7% |
| Range | 38.1% | 18.9% |
| Mean | 8.7% | 9.9% |
| Median | 7.4% | 7.7% |
| Interquartile 25% (IQ1) | 6.2% | 6.4% |
| Interquartile 75% (IQ3) | 10.6% | 11.2% |
| Interquartile Range (IQR) | 4.3% | 4.7% |
| Standard Deviation (Sample) | 6.3% | 5.0% |
| Standard Deviation (Population) | 6.2% | 4.9% |
Similar Demographics by Family Poverty
Demographics Similar to Jordanians by Family Poverty
In terms of family poverty, the demographic groups most similar to Jordanians are Basque (8.1%, a difference of 0.090%), Romanian (8.2%, a difference of 0.090%), Taiwanese (8.2%, a difference of 0.15%), French Canadian (8.1%, a difference of 0.18%), and Egyptian (8.1%, a difference of 0.22%).
| Demographics | Rating | Rank | Family Poverty |
| Immigrants | Indonesia | 95.7 /100 | #102 | Exceptional 8.1% |
| Immigrants | Eastern Europe | 95.6 /100 | #103 | Exceptional 8.1% |
| Slavs | 95.6 /100 | #104 | Exceptional 8.1% |
| Laotians | 95.6 /100 | #105 | Exceptional 8.1% |
| Egyptians | 95.1 /100 | #106 | Exceptional 8.1% |
| French Canadians | 95.0 /100 | #107 | Exceptional 8.1% |
| Basques | 94.9 /100 | #108 | Exceptional 8.1% |
| Jordanians | 94.8 /100 | #109 | Exceptional 8.2% |
| Romanians | 94.7 /100 | #110 | Exceptional 8.2% |
| Taiwanese | 94.6 /100 | #111 | Exceptional 8.2% |
| Immigrants | France | 94.4 /100 | #112 | Exceptional 8.2% |
| Canadians | 94.2 /100 | #113 | Exceptional 8.2% |
| Immigrants | Zimbabwe | 94.0 /100 | #114 | Exceptional 8.2% |
| Immigrants | Israel | 93.5 /100 | #115 | Exceptional 8.2% |
| South Africans | 93.4 /100 | #116 | Exceptional 8.2% |
Demographics Similar to Tsimshian by Family Poverty
In terms of family poverty, the demographic groups most similar to Tsimshian are White/Caucasian (8.8%, a difference of 0.040%), Peruvian (8.8%, a difference of 0.20%), Immigrants from Oceania (8.7%, a difference of 0.30%), Hungarian (8.8%, a difference of 0.34%), and Immigrants from Northern Africa (8.8%, a difference of 0.38%).
| Demographics | Rating | Rank | Family Poverty |
| Syrians | 80.3 /100 | #150 | Excellent 8.6% |
| Brazilians | 80.1 /100 | #151 | Excellent 8.6% |
| Samoans | 79.8 /100 | #152 | Good 8.6% |
| Immigrants | Spain | 79.1 /100 | #153 | Good 8.6% |
| Immigrants | Vietnam | 75.4 /100 | #154 | Good 8.7% |
| Immigrants | Kuwait | 73.6 /100 | #155 | Good 8.7% |
| Immigrants | Oceania | 71.2 /100 | #156 | Good 8.7% |
| Tsimshian | 69.3 /100 | #157 | Good 8.8% |
| Whites/Caucasians | 69.1 /100 | #158 | Good 8.8% |
| Peruvians | 68.0 /100 | #159 | Good 8.8% |
| Hungarians | 67.2 /100 | #160 | Good 8.8% |
| Immigrants | Northern Africa | 66.9 /100 | #161 | Good 8.8% |
| Ethiopians | 66.3 /100 | #162 | Good 8.8% |
| Pennsylvania Germans | 66.0 /100 | #163 | Good 8.8% |
| Celtics | 64.9 /100 | #164 | Good 8.8% |