Jordanian vs Palestinian Family Poverty
COMPARE
Jordanian
Palestinian
Family Poverty
Family Poverty Comparison
Jordanians
Palestinians
8.2%
FAMILY POVERTY
94.8/ 100
METRIC RATING
109th/ 347
METRIC RANK
8.3%
FAMILY POVERTY
91.1/ 100
METRIC RATING
123rd/ 347
METRIC RANK
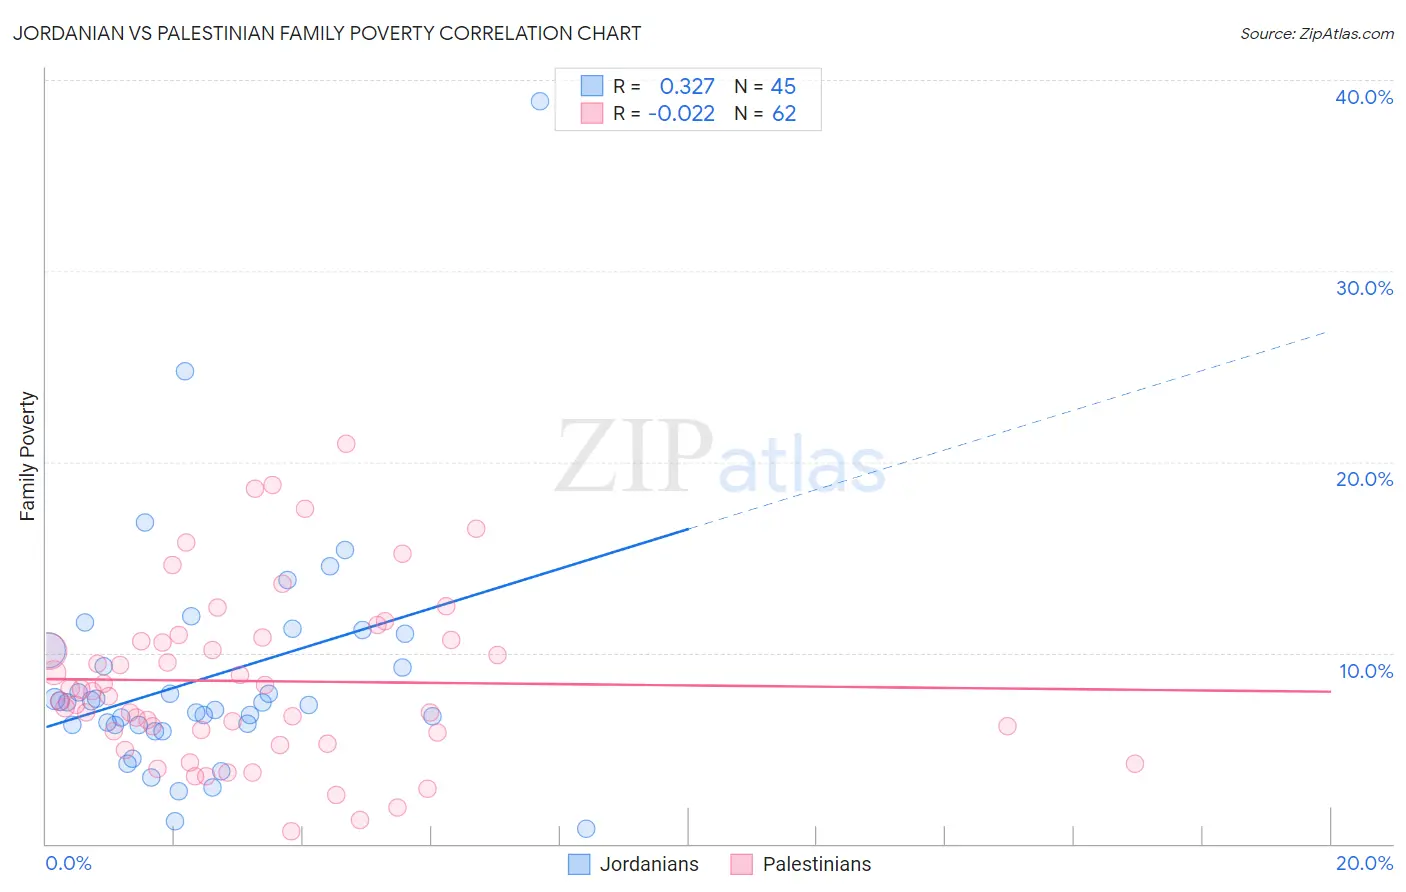
Jordanian vs Palestinian Family Poverty Correlation Chart
The statistical analysis conducted on geographies consisting of 166,331,422 people shows a mild positive correlation between the proportion of Jordanians and poverty level among families in the United States with a correlation coefficient (R) of 0.327 and weighted average of 8.2%. Similarly, the statistical analysis conducted on geographies consisting of 216,211,799 people shows no correlation between the proportion of Palestinians and poverty level among families in the United States with a correlation coefficient (R) of -0.022 and weighted average of 8.3%, a difference of 2.1%.
Family Poverty Correlation Summary
| Measurement | Jordanian | Palestinian |
| Minimum | 0.81% | 0.67% |
| Maximum | 38.9% | 21.0% |
| Range | 38.1% | 20.3% |
| Mean | 8.7% | 8.5% |
| Median | 7.4% | 7.9% |
| Interquartile 25% (IQ1) | 6.2% | 5.8% |
| Interquartile 75% (IQ3) | 10.6% | 10.7% |
| Interquartile Range (IQR) | 4.3% | 4.9% |
| Standard Deviation (Sample) | 6.3% | 4.5% |
| Standard Deviation (Population) | 6.2% | 4.4% |
Demographics Similar to Jordanians and Palestinians by Family Poverty
In terms of family poverty, the demographic groups most similar to Jordanians are Basque (8.1%, a difference of 0.090%), Romanian (8.2%, a difference of 0.090%), Taiwanese (8.2%, a difference of 0.15%), French Canadian (8.1%, a difference of 0.18%), and Egyptian (8.1%, a difference of 0.22%). Similarly, the demographic groups most similar to Palestinians are Paraguayan (8.3%, a difference of 0.070%), Native Hawaiian (8.3%, a difference of 0.080%), Soviet Union (8.3%, a difference of 0.10%), Pakistani (8.3%, a difference of 0.14%), and Immigrants from Egypt (8.3%, a difference of 0.25%).
| Demographics | Rating | Rank | Family Poverty |
| Egyptians | 95.1 /100 | #106 | Exceptional 8.1% |
| French Canadians | 95.0 /100 | #107 | Exceptional 8.1% |
| Basques | 94.9 /100 | #108 | Exceptional 8.1% |
| Jordanians | 94.8 /100 | #109 | Exceptional 8.2% |
| Romanians | 94.7 /100 | #110 | Exceptional 8.2% |
| Taiwanese | 94.6 /100 | #111 | Exceptional 8.2% |
| Immigrants | France | 94.4 /100 | #112 | Exceptional 8.2% |
| Canadians | 94.2 /100 | #113 | Exceptional 8.2% |
| Immigrants | Zimbabwe | 94.0 /100 | #114 | Exceptional 8.2% |
| Immigrants | Israel | 93.5 /100 | #115 | Exceptional 8.2% |
| South Africans | 93.4 /100 | #116 | Exceptional 8.2% |
| Immigrants | Russia | 93.2 /100 | #117 | Exceptional 8.2% |
| Immigrants | Western Europe | 92.9 /100 | #118 | Exceptional 8.2% |
| French | 92.8 /100 | #119 | Exceptional 8.3% |
| Immigrants | Egypt | 91.6 /100 | #120 | Exceptional 8.3% |
| Native Hawaiians | 91.3 /100 | #121 | Exceptional 8.3% |
| Paraguayans | 91.2 /100 | #122 | Exceptional 8.3% |
| Palestinians | 91.1 /100 | #123 | Exceptional 8.3% |
| Soviet Union | 90.8 /100 | #124 | Exceptional 8.3% |
| Pakistanis | 90.8 /100 | #125 | Exceptional 8.3% |
| Icelanders | 90.3 /100 | #126 | Exceptional 8.3% |