Jordanian vs Immigrants from England Family Households
COMPARE
Jordanian
Immigrants from England
Family Households
Family Households Comparison
Jordanians
Immigrants from England
65.5%
FAMILY HOUSEHOLDS
99.7/ 100
METRIC RATING
81st/ 347
METRIC RANK
64.4%
FAMILY HOUSEHOLDS
62.6/ 100
METRIC RATING
161st/ 347
METRIC RANK
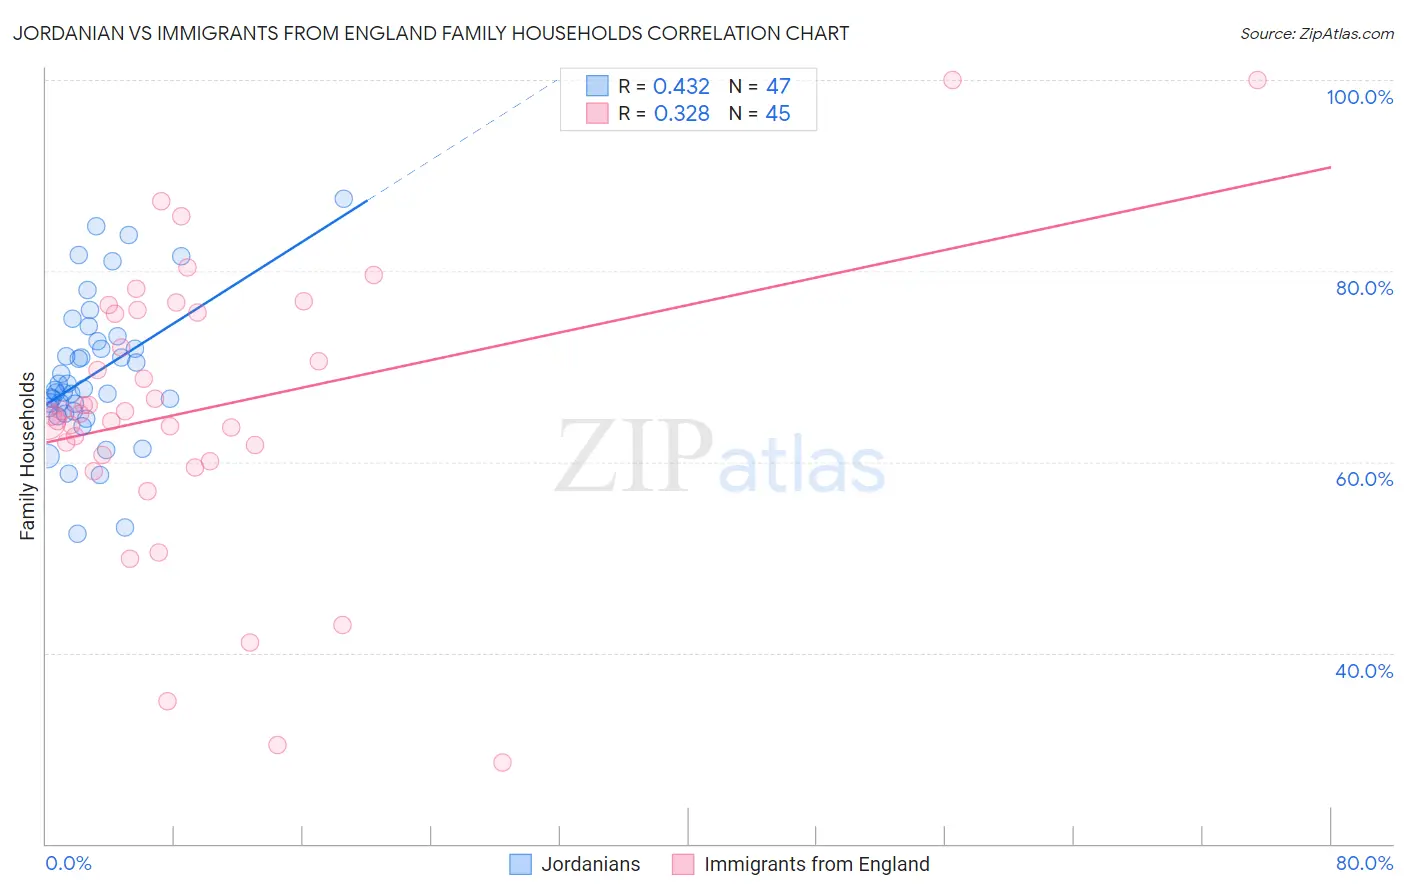
Jordanian vs Immigrants from England Family Households Correlation Chart
The statistical analysis conducted on geographies consisting of 166,395,405 people shows a moderate positive correlation between the proportion of Jordanians and percentage of family households in the United States with a correlation coefficient (R) of 0.432 and weighted average of 65.5%. Similarly, the statistical analysis conducted on geographies consisting of 391,752,954 people shows a mild positive correlation between the proportion of Immigrants from England and percentage of family households in the United States with a correlation coefficient (R) of 0.328 and weighted average of 64.4%, a difference of 1.8%.
Family Households Correlation Summary
| Measurement | Jordanian | Immigrants from England |
| Minimum | 52.5% | 28.6% |
| Maximum | 87.5% | 100.0% |
| Range | 35.0% | 71.4% |
| Mean | 69.1% | 65.6% |
| Median | 67.5% | 65.0% |
| Interquartile 25% (IQ1) | 65.3% | 60.4% |
| Interquartile 75% (IQ3) | 72.6% | 75.8% |
| Interquartile Range (IQR) | 7.3% | 15.4% |
| Standard Deviation (Sample) | 7.5% | 15.1% |
| Standard Deviation (Population) | 7.5% | 14.9% |
Similar Demographics by Family Households
Demographics Similar to Jordanians by Family Households
In terms of family households, the demographic groups most similar to Jordanians are Immigrants from Lebanon (65.5%, a difference of 0.040%), Immigrants from Guyana (65.5%, a difference of 0.040%), American (65.5%, a difference of 0.060%), Puget Sound Salish (65.6%, a difference of 0.080%), and Immigrants from Costa Rica (65.6%, a difference of 0.10%).
| Demographics | Rating | Rank | Family Households |
| Burmese | 99.9 /100 | #74 | Exceptional 65.7% |
| Houma | 99.9 /100 | #75 | Exceptional 65.7% |
| Immigrants | Azores | 99.8 /100 | #76 | Exceptional 65.6% |
| Immigrants | South America | 99.8 /100 | #77 | Exceptional 65.6% |
| Yaqui | 99.8 /100 | #78 | Exceptional 65.6% |
| Immigrants | Costa Rica | 99.8 /100 | #79 | Exceptional 65.6% |
| Puget Sound Salish | 99.8 /100 | #80 | Exceptional 65.6% |
| Jordanians | 99.7 /100 | #81 | Exceptional 65.5% |
| Immigrants | Lebanon | 99.7 /100 | #82 | Exceptional 65.5% |
| Immigrants | Guyana | 99.6 /100 | #83 | Exceptional 65.5% |
| Americans | 99.6 /100 | #84 | Exceptional 65.5% |
| Immigrants | Cambodia | 99.5 /100 | #85 | Exceptional 65.4% |
| Egyptians | 99.4 /100 | #86 | Exceptional 65.4% |
| Immigrants | Egypt | 99.2 /100 | #87 | Exceptional 65.3% |
| Immigrants | Haiti | 99.1 /100 | #88 | Exceptional 65.3% |
Demographics Similar to Immigrants from England by Family Households
In terms of family households, the demographic groups most similar to Immigrants from England are British (64.4%, a difference of 0.010%), Chickasaw (64.4%, a difference of 0.020%), Immigrants from Moldova (64.4%, a difference of 0.040%), Immigrants from Nigeria (64.4%, a difference of 0.040%), and Immigrants from Southern Europe (64.4%, a difference of 0.040%).
| Demographics | Rating | Rank | Family Households |
| Austrians | 68.5 /100 | #154 | Good 64.5% |
| Uruguayans | 67.7 /100 | #155 | Good 64.5% |
| Czechs | 67.0 /100 | #156 | Good 64.5% |
| Canadians | 66.6 /100 | #157 | Good 64.4% |
| Lebanese | 66.4 /100 | #158 | Good 64.4% |
| Germans | 65.8 /100 | #159 | Good 64.4% |
| Immigrants | Moldova | 65.2 /100 | #160 | Good 64.4% |
| Immigrants | England | 62.6 /100 | #161 | Good 64.4% |
| British | 61.6 /100 | #162 | Good 64.4% |
| Chickasaw | 61.5 /100 | #163 | Good 64.4% |
| Immigrants | Nigeria | 60.1 /100 | #164 | Good 64.4% |
| Immigrants | Southern Europe | 60.0 /100 | #165 | Good 64.4% |
| Scotch-Irish | 59.2 /100 | #166 | Average 64.4% |
| Irish | 57.9 /100 | #167 | Average 64.4% |
| Hondurans | 57.5 /100 | #168 | Average 64.4% |