Jordanian vs Immigrants from Burma/Myanmar Child Poverty Under the Age of 5
COMPARE
Jordanian
Immigrants from Burma/Myanmar
Child Poverty Under the Age of 5
Child Poverty Under the Age of 5 Comparison
Jordanians
Immigrants from Burma/Myanmar
15.6%
CHILD POVERTY UNDER THE AGE OF 5
97.3/ 100
METRIC RATING
88th/ 347
METRIC RANK
20.4%
CHILD POVERTY UNDER THE AGE OF 5
0.1/ 100
METRIC RATING
269th/ 347
METRIC RANK
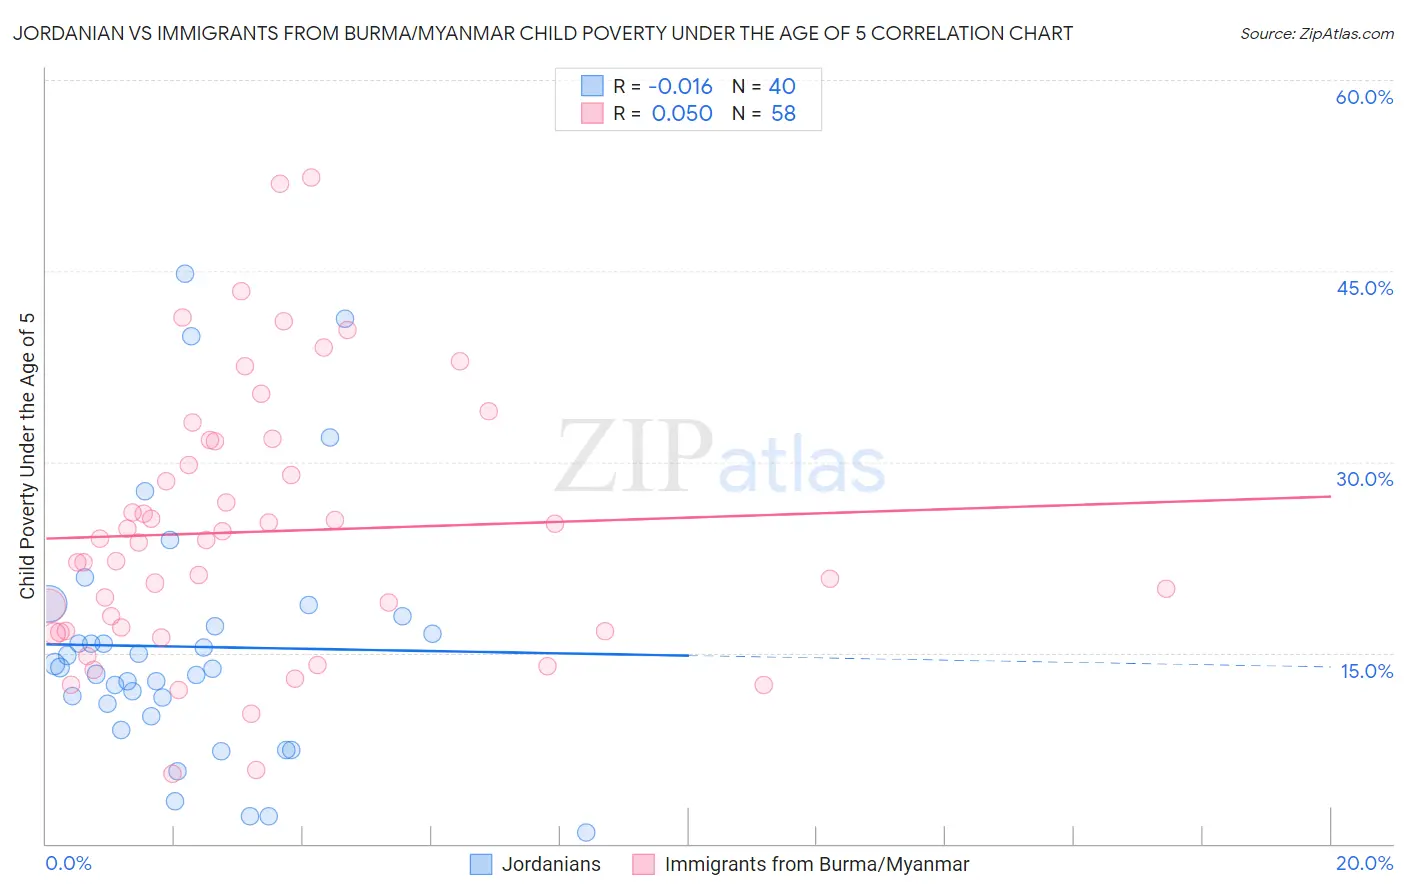
Jordanian vs Immigrants from Burma/Myanmar Child Poverty Under the Age of 5 Correlation Chart
The statistical analysis conducted on geographies consisting of 163,681,474 people shows no correlation between the proportion of Jordanians and poverty level among children under the age of 5 in the United States with a correlation coefficient (R) of -0.016 and weighted average of 15.6%. Similarly, the statistical analysis conducted on geographies consisting of 169,386,512 people shows a slight positive correlation between the proportion of Immigrants from Burma/Myanmar and poverty level among children under the age of 5 in the United States with a correlation coefficient (R) of 0.050 and weighted average of 20.4%, a difference of 30.3%.
Child Poverty Under the Age of 5 Correlation Summary
| Measurement | Jordanian | Immigrants from Burma/Myanmar |
| Minimum | 0.93% | 5.5% |
| Maximum | 44.7% | 52.3% |
| Range | 43.8% | 46.9% |
| Mean | 15.5% | 24.5% |
| Median | 13.8% | 23.8% |
| Interquartile 25% (IQ1) | 10.5% | 16.7% |
| Interquartile 75% (IQ3) | 17.5% | 31.6% |
| Interquartile Range (IQR) | 7.0% | 15.0% |
| Standard Deviation (Sample) | 9.9% | 10.5% |
| Standard Deviation (Population) | 9.8% | 10.4% |
Similar Demographics by Child Poverty Under the Age of 5
Demographics Similar to Jordanians by Child Poverty Under the Age of 5
In terms of child poverty under the age of 5, the demographic groups most similar to Jordanians are Immigrants from Vietnam (15.6%, a difference of 0.050%), Immigrants from Croatia (15.6%, a difference of 0.060%), Immigrants from France (15.6%, a difference of 0.060%), Immigrants from Malaysia (15.6%, a difference of 0.13%), and Immigrants from Latvia (15.6%, a difference of 0.14%).
| Demographics | Rating | Rank | Child Poverty Under the Age of 5 |
| Czechs | 97.8 /100 | #81 | Exceptional 15.5% |
| Immigrants | Italy | 97.7 /100 | #82 | Exceptional 15.6% |
| Chileans | 97.6 /100 | #83 | Exceptional 15.6% |
| Immigrants | Netherlands | 97.6 /100 | #84 | Exceptional 15.6% |
| Immigrants | Latvia | 97.4 /100 | #85 | Exceptional 15.6% |
| Immigrants | Malaysia | 97.4 /100 | #86 | Exceptional 15.6% |
| Immigrants | Vietnam | 97.4 /100 | #87 | Exceptional 15.6% |
| Jordanians | 97.3 /100 | #88 | Exceptional 15.6% |
| Immigrants | Croatia | 97.3 /100 | #89 | Exceptional 15.6% |
| Immigrants | France | 97.3 /100 | #90 | Exceptional 15.6% |
| Poles | 97.2 /100 | #91 | Exceptional 15.7% |
| Scandinavians | 97.1 /100 | #92 | Exceptional 15.7% |
| Ukrainians | 97.1 /100 | #93 | Exceptional 15.7% |
| Immigrants | South Eastern Asia | 97.1 /100 | #94 | Exceptional 15.7% |
| Immigrants | Switzerland | 96.4 /100 | #95 | Exceptional 15.8% |
Demographics Similar to Immigrants from Burma/Myanmar by Child Poverty Under the Age of 5
In terms of child poverty under the age of 5, the demographic groups most similar to Immigrants from Burma/Myanmar are Jamaican (20.4%, a difference of 0.070%), Ottawa (20.3%, a difference of 0.090%), Belizean (20.3%, a difference of 0.090%), Aleut (20.3%, a difference of 0.48%), and American (20.5%, a difference of 0.52%).
| Demographics | Rating | Rank | Child Poverty Under the Age of 5 |
| Liberians | 0.1 /100 | #262 | Tragic 20.2% |
| Barbadians | 0.1 /100 | #263 | Tragic 20.2% |
| Immigrants | Liberia | 0.1 /100 | #264 | Tragic 20.2% |
| Spanish American Indians | 0.1 /100 | #265 | Tragic 20.2% |
| Aleuts | 0.1 /100 | #266 | Tragic 20.3% |
| Ottawa | 0.1 /100 | #267 | Tragic 20.3% |
| Belizeans | 0.1 /100 | #268 | Tragic 20.3% |
| Immigrants | Burma/Myanmar | 0.1 /100 | #269 | Tragic 20.4% |
| Jamaicans | 0.1 /100 | #270 | Tragic 20.4% |
| Americans | 0.1 /100 | #271 | Tragic 20.5% |
| Immigrants | Jamaica | 0.1 /100 | #272 | Tragic 20.5% |
| Central Americans | 0.1 /100 | #273 | Tragic 20.6% |
| Immigrants | Belize | 0.1 /100 | #274 | Tragic 20.6% |
| Bangladeshis | 0.1 /100 | #275 | Tragic 20.6% |
| West Indians | 0.0 /100 | #276 | Tragic 20.6% |