Jordanian vs Carpatho Rusyn Single Mother Poverty
COMPARE
Jordanian
Carpatho Rusyn
Single Mother Poverty
Single Mother Poverty Comparison
Jordanians
Carpatho Rusyns
26.4%
SINGLE MOTHER POVERTY
100.0/ 100
METRIC RATING
29th/ 347
METRIC RANK
29.1%
SINGLE MOTHER POVERTY
53.8/ 100
METRIC RATING
172nd/ 347
METRIC RANK
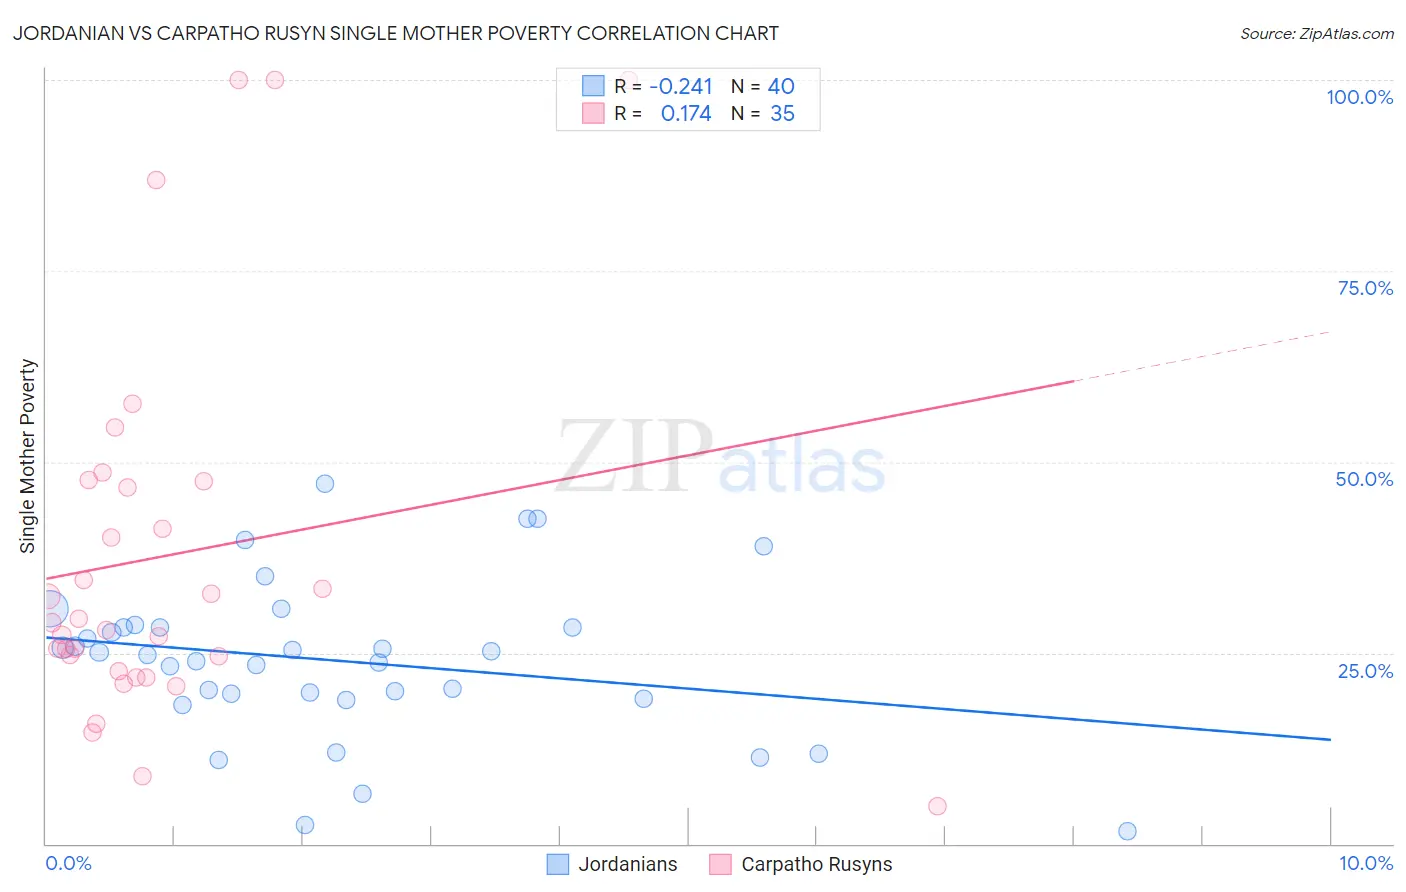
Jordanian vs Carpatho Rusyn Single Mother Poverty Correlation Chart
The statistical analysis conducted on geographies consisting of 164,762,978 people shows a weak negative correlation between the proportion of Jordanians and poverty level among single mothers in the United States with a correlation coefficient (R) of -0.241 and weighted average of 26.4%. Similarly, the statistical analysis conducted on geographies consisting of 58,401,773 people shows a poor positive correlation between the proportion of Carpatho Rusyns and poverty level among single mothers in the United States with a correlation coefficient (R) of 0.174 and weighted average of 29.1%, a difference of 10.2%.
Single Mother Poverty Correlation Summary
| Measurement | Jordanian | Carpatho Rusyn |
| Minimum | 1.7% | 4.9% |
| Maximum | 47.1% | 100.0% |
| Range | 45.4% | 95.1% |
| Mean | 24.0% | 37.8% |
| Median | 24.9% | 28.9% |
| Interquartile 25% (IQ1) | 19.3% | 22.6% |
| Interquartile 75% (IQ3) | 28.3% | 47.5% |
| Interquartile Range (IQR) | 9.0% | 25.0% |
| Standard Deviation (Sample) | 10.2% | 24.7% |
| Standard Deviation (Population) | 10.1% | 24.3% |
Similar Demographics by Single Mother Poverty
Demographics Similar to Jordanians by Single Mother Poverty
In terms of single mother poverty, the demographic groups most similar to Jordanians are Korean (26.4%, a difference of 0.050%), Immigrants from Japan (26.4%, a difference of 0.070%), Turkish (26.4%, a difference of 0.090%), Immigrants from Philippines (26.5%, a difference of 0.24%), and Immigrants from Sri Lanka (26.3%, a difference of 0.29%).
| Demographics | Rating | Rank | Single Mother Poverty |
| Immigrants | Korea | 100.0 /100 | #22 | Exceptional 26.2% |
| Burmese | 100.0 /100 | #23 | Exceptional 26.2% |
| Immigrants | Moldova | 100.0 /100 | #24 | Exceptional 26.2% |
| Immigrants | Asia | 100.0 /100 | #25 | Exceptional 26.3% |
| Immigrants | Sri Lanka | 100.0 /100 | #26 | Exceptional 26.3% |
| Immigrants | Japan | 100.0 /100 | #27 | Exceptional 26.4% |
| Koreans | 100.0 /100 | #28 | Exceptional 26.4% |
| Jordanians | 100.0 /100 | #29 | Exceptional 26.4% |
| Turks | 100.0 /100 | #30 | Exceptional 26.4% |
| Immigrants | Philippines | 100.0 /100 | #31 | Exceptional 26.5% |
| Tongans | 99.9 /100 | #32 | Exceptional 26.5% |
| Bulgarians | 99.9 /100 | #33 | Exceptional 26.5% |
| Immigrants | Indonesia | 99.9 /100 | #34 | Exceptional 26.6% |
| Maltese | 99.9 /100 | #35 | Exceptional 26.6% |
| Okinawans | 99.9 /100 | #36 | Exceptional 26.6% |
Demographics Similar to Carpatho Rusyns by Single Mother Poverty
In terms of single mother poverty, the demographic groups most similar to Carpatho Rusyns are New Zealander (29.1%, a difference of 0.060%), Puget Sound Salish (29.1%, a difference of 0.060%), British (29.2%, a difference of 0.16%), Immigrants from Uruguay (29.1%, a difference of 0.17%), and European (29.1%, a difference of 0.18%).
| Demographics | Rating | Rank | Single Mother Poverty |
| Arabs | 60.7 /100 | #165 | Good 29.0% |
| Inupiat | 60.4 /100 | #166 | Good 29.0% |
| Costa Ricans | 58.4 /100 | #167 | Average 29.0% |
| Europeans | 57.6 /100 | #168 | Average 29.1% |
| Immigrants | Uruguay | 57.2 /100 | #169 | Average 29.1% |
| New Zealanders | 55.1 /100 | #170 | Average 29.1% |
| Puget Sound Salish | 55.1 /100 | #171 | Average 29.1% |
| Carpatho Rusyns | 53.8 /100 | #172 | Average 29.1% |
| British | 50.6 /100 | #173 | Average 29.2% |
| Immigrants | Saudi Arabia | 50.0 /100 | #174 | Average 29.2% |
| Immigrants | Costa Rica | 48.8 /100 | #175 | Average 29.2% |
| Hawaiians | 47.8 /100 | #176 | Average 29.2% |
| Immigrants | Bosnia and Herzegovina | 45.1 /100 | #177 | Average 29.2% |
| South American Indians | 43.2 /100 | #178 | Average 29.3% |
| Immigrants | Uzbekistan | 42.6 /100 | #179 | Average 29.3% |