Jordanian vs Cajun Professional Degree
COMPARE
Jordanian
Cajun
Professional Degree
Professional Degree Comparison
Jordanians
Cajuns
4.7%
PROFESSIONAL DEGREE
88.9/ 100
METRIC RATING
137th/ 347
METRIC RANK
3.4%
PROFESSIONAL DEGREE
0.2/ 100
METRIC RATING
304th/ 347
METRIC RANK
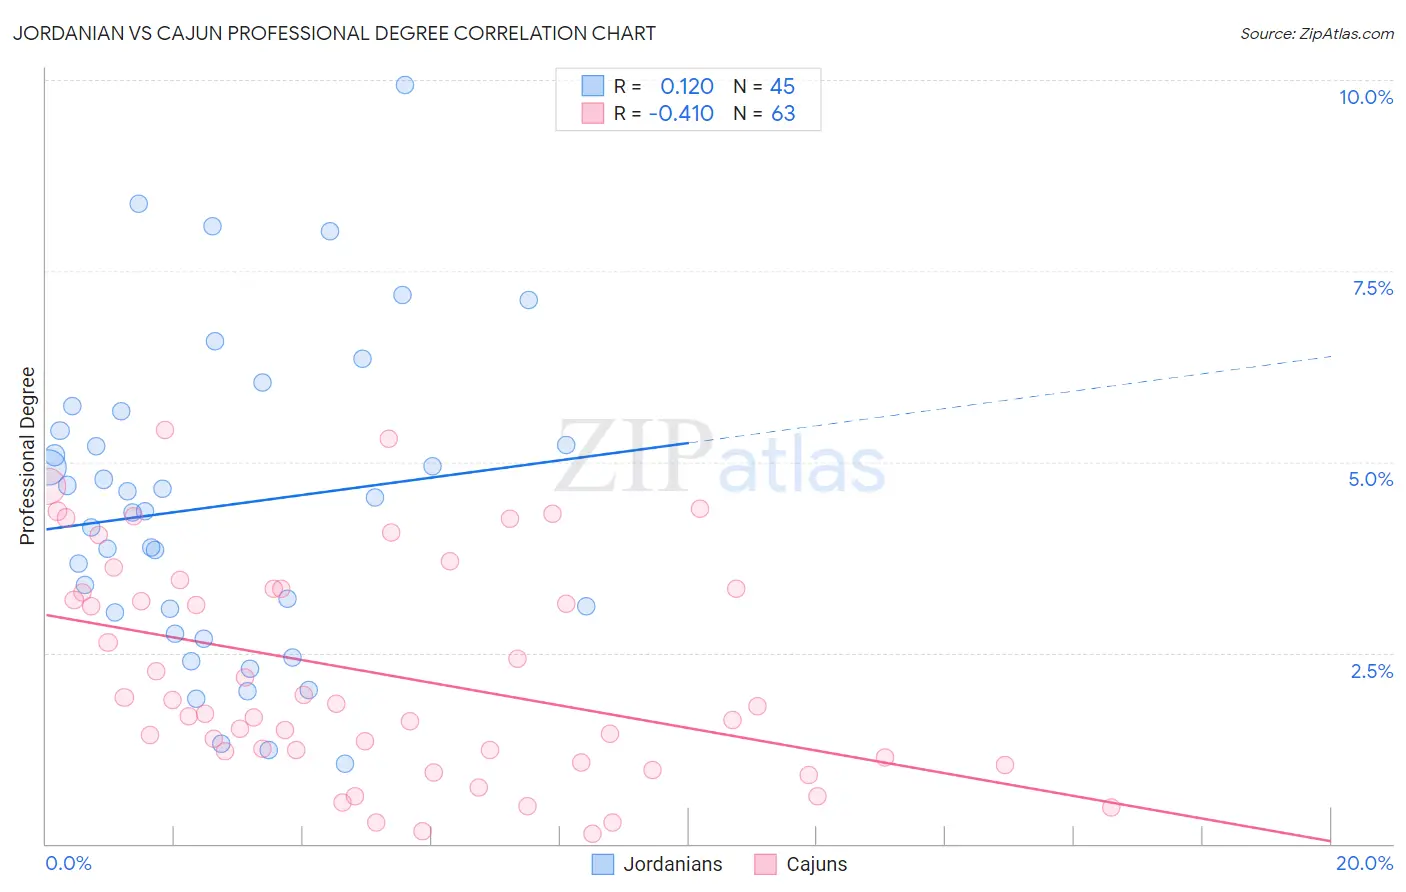
Jordanian vs Cajun Professional Degree Correlation Chart
The statistical analysis conducted on geographies consisting of 166,340,382 people shows a poor positive correlation between the proportion of Jordanians and percentage of population with at least professional degree education in the United States with a correlation coefficient (R) of 0.120 and weighted average of 4.7%. Similarly, the statistical analysis conducted on geographies consisting of 149,296,095 people shows a moderate negative correlation between the proportion of Cajuns and percentage of population with at least professional degree education in the United States with a correlation coefficient (R) of -0.410 and weighted average of 3.4%, a difference of 40.6%.
Professional Degree Correlation Summary
| Measurement | Jordanian | Cajun |
| Minimum | 1.0% | 0.14% |
| Maximum | 9.9% | 5.4% |
| Range | 8.9% | 5.3% |
| Mean | 4.4% | 2.2% |
| Median | 4.4% | 1.8% |
| Interquartile 25% (IQ1) | 2.9% | 1.1% |
| Interquartile 75% (IQ3) | 5.5% | 3.3% |
| Interquartile Range (IQR) | 2.7% | 2.2% |
| Standard Deviation (Sample) | 2.0% | 1.4% |
| Standard Deviation (Population) | 2.0% | 1.4% |
Similar Demographics by Professional Degree
Demographics Similar to Jordanians by Professional Degree
In terms of professional degree, the demographic groups most similar to Jordanians are Immigrants from Jordan (4.7%, a difference of 0.020%), Afghan (4.7%, a difference of 0.040%), Macedonian (4.8%, a difference of 0.30%), South American Indian (4.8%, a difference of 0.34%), and Italian (4.8%, a difference of 0.46%).
| Demographics | Rating | Rank | Professional Degree |
| Icelanders | 91.5 /100 | #130 | Exceptional 4.8% |
| Immigrants | Nepal | 91.4 /100 | #131 | Exceptional 4.8% |
| Pakistanis | 90.9 /100 | #132 | Exceptional 4.8% |
| Italians | 90.2 /100 | #133 | Exceptional 4.8% |
| South American Indians | 89.9 /100 | #134 | Excellent 4.8% |
| Macedonians | 89.8 /100 | #135 | Excellent 4.8% |
| Immigrants | Jordan | 89.0 /100 | #136 | Excellent 4.7% |
| Jordanians | 88.9 /100 | #137 | Excellent 4.7% |
| Afghans | 88.8 /100 | #138 | Excellent 4.7% |
| South Americans | 85.6 /100 | #139 | Excellent 4.7% |
| Canadians | 84.4 /100 | #140 | Excellent 4.7% |
| Basques | 81.8 /100 | #141 | Excellent 4.6% |
| Sudanese | 81.3 /100 | #142 | Excellent 4.6% |
| Hungarians | 80.8 /100 | #143 | Excellent 4.6% |
| Immigrants | South America | 80.5 /100 | #144 | Excellent 4.6% |
Demographics Similar to Cajuns by Professional Degree
In terms of professional degree, the demographic groups most similar to Cajuns are Immigrants from Haiti (3.4%, a difference of 0.010%), Chickasaw (3.4%, a difference of 0.30%), Cape Verdean (3.4%, a difference of 0.31%), Malaysian (3.4%, a difference of 0.66%), and Immigrants from Dominican Republic (3.4%, a difference of 0.77%).
| Demographics | Rating | Rank | Professional Degree |
| Immigrants | Liberia | 0.2 /100 | #297 | Tragic 3.4% |
| Ottawa | 0.2 /100 | #298 | Tragic 3.4% |
| Immigrants | Yemen | 0.2 /100 | #299 | Tragic 3.4% |
| Blacks/African Americans | 0.2 /100 | #300 | Tragic 3.4% |
| Immigrants | Dominican Republic | 0.2 /100 | #301 | Tragic 3.4% |
| Malaysians | 0.2 /100 | #302 | Tragic 3.4% |
| Immigrants | Haiti | 0.2 /100 | #303 | Tragic 3.4% |
| Cajuns | 0.2 /100 | #304 | Tragic 3.4% |
| Chickasaw | 0.1 /100 | #305 | Tragic 3.4% |
| Cape Verdeans | 0.1 /100 | #306 | Tragic 3.4% |
| Samoans | 0.1 /100 | #307 | Tragic 3.3% |
| Shoshone | 0.1 /100 | #308 | Tragic 3.3% |
| Pima | 0.1 /100 | #309 | Tragic 3.3% |
| Immigrants | Latin America | 0.1 /100 | #310 | Tragic 3.3% |
| Cherokee | 0.1 /100 | #311 | Tragic 3.3% |