Jordanian vs Immigrants from Jordan Single Mother Poverty
COMPARE
Jordanian
Immigrants from Jordan
Single Mother Poverty
Single Mother Poverty Comparison
Jordanians
Immigrants from Jordan
26.4%
SINGLE MOTHER POVERTY
100.0/ 100
METRIC RATING
29th/ 347
METRIC RANK
27.1%
SINGLE MOTHER POVERTY
99.7/ 100
METRIC RATING
53rd/ 347
METRIC RANK
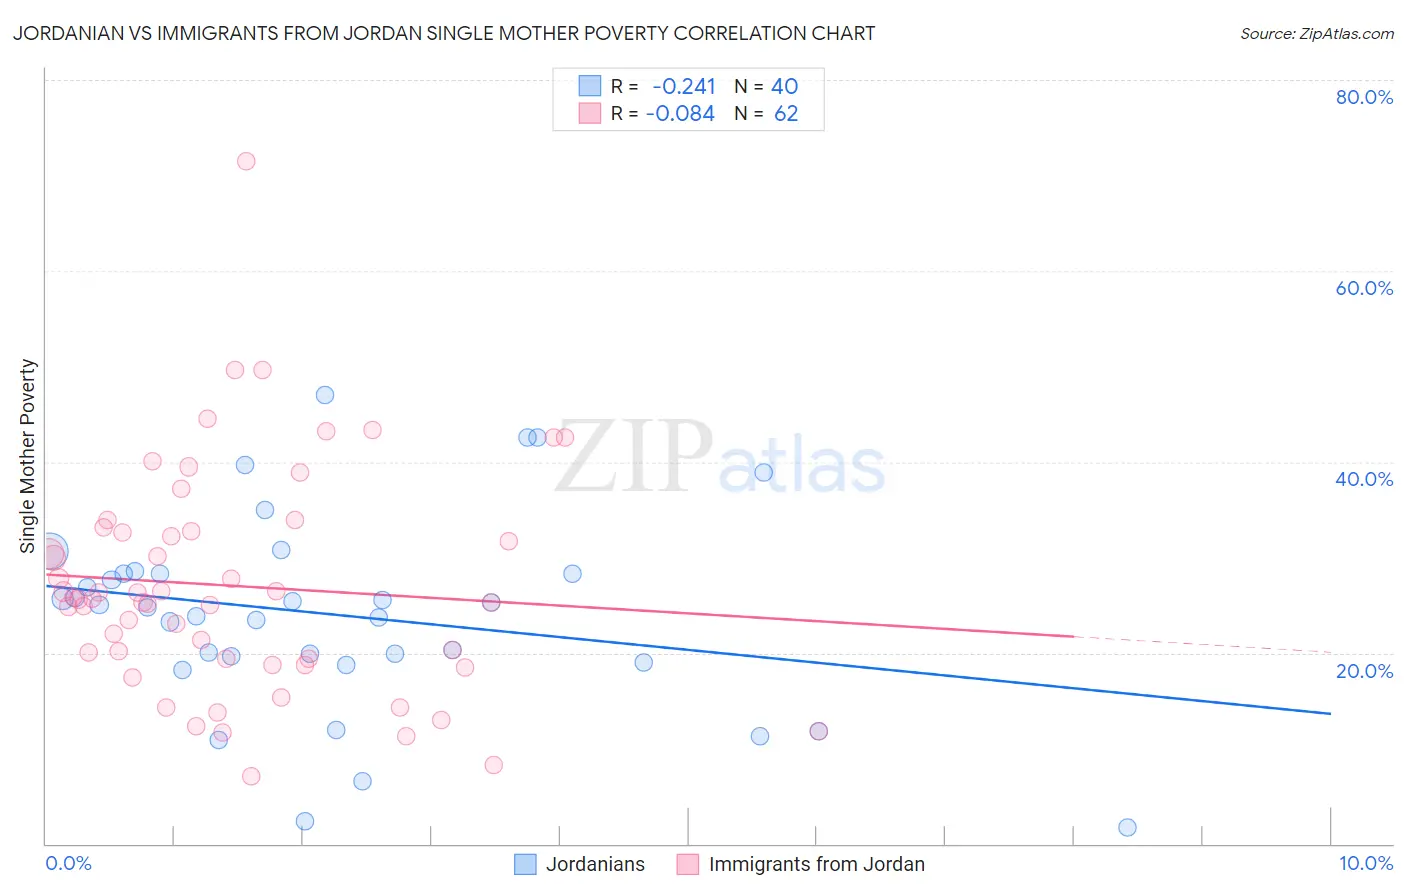
Jordanian vs Immigrants from Jordan Single Mother Poverty Correlation Chart
The statistical analysis conducted on geographies consisting of 164,762,978 people shows a weak negative correlation between the proportion of Jordanians and poverty level among single mothers in the United States with a correlation coefficient (R) of -0.241 and weighted average of 26.4%. Similarly, the statistical analysis conducted on geographies consisting of 179,287,213 people shows a slight negative correlation between the proportion of Immigrants from Jordan and poverty level among single mothers in the United States with a correlation coefficient (R) of -0.084 and weighted average of 27.1%, a difference of 2.7%.
Single Mother Poverty Correlation Summary
| Measurement | Jordanian | Immigrants from Jordan |
| Minimum | 1.7% | 7.0% |
| Maximum | 47.1% | 71.6% |
| Range | 45.4% | 64.5% |
| Mean | 24.0% | 27.0% |
| Median | 24.9% | 25.6% |
| Interquartile 25% (IQ1) | 19.3% | 19.4% |
| Interquartile 75% (IQ3) | 28.3% | 32.7% |
| Interquartile Range (IQR) | 9.0% | 13.3% |
| Standard Deviation (Sample) | 10.2% | 11.7% |
| Standard Deviation (Population) | 10.1% | 11.6% |
Similar Demographics by Single Mother Poverty
Demographics Similar to Jordanians by Single Mother Poverty
In terms of single mother poverty, the demographic groups most similar to Jordanians are Korean (26.4%, a difference of 0.050%), Immigrants from Japan (26.4%, a difference of 0.070%), Turkish (26.4%, a difference of 0.090%), Immigrants from Philippines (26.5%, a difference of 0.24%), and Immigrants from Sri Lanka (26.3%, a difference of 0.29%).
| Demographics | Rating | Rank | Single Mother Poverty |
| Immigrants | Korea | 100.0 /100 | #22 | Exceptional 26.2% |
| Burmese | 100.0 /100 | #23 | Exceptional 26.2% |
| Immigrants | Moldova | 100.0 /100 | #24 | Exceptional 26.2% |
| Immigrants | Asia | 100.0 /100 | #25 | Exceptional 26.3% |
| Immigrants | Sri Lanka | 100.0 /100 | #26 | Exceptional 26.3% |
| Immigrants | Japan | 100.0 /100 | #27 | Exceptional 26.4% |
| Koreans | 100.0 /100 | #28 | Exceptional 26.4% |
| Jordanians | 100.0 /100 | #29 | Exceptional 26.4% |
| Turks | 100.0 /100 | #30 | Exceptional 26.4% |
| Immigrants | Philippines | 100.0 /100 | #31 | Exceptional 26.5% |
| Tongans | 99.9 /100 | #32 | Exceptional 26.5% |
| Bulgarians | 99.9 /100 | #33 | Exceptional 26.5% |
| Immigrants | Indonesia | 99.9 /100 | #34 | Exceptional 26.6% |
| Maltese | 99.9 /100 | #35 | Exceptional 26.6% |
| Okinawans | 99.9 /100 | #36 | Exceptional 26.6% |
Demographics Similar to Immigrants from Jordan by Single Mother Poverty
In terms of single mother poverty, the demographic groups most similar to Immigrants from Jordan are Immigrants from Bulgaria (27.1%, a difference of 0.030%), Immigrants from South Eastern Asia (27.1%, a difference of 0.040%), Immigrants from Egypt (27.1%, a difference of 0.060%), Immigrants from Argentina (27.1%, a difference of 0.080%), and Immigrants from Romania (27.2%, a difference of 0.11%).
| Demographics | Rating | Rank | Single Mother Poverty |
| Immigrants | Serbia | 99.9 /100 | #46 | Exceptional 26.9% |
| Egyptians | 99.8 /100 | #47 | Exceptional 26.9% |
| Immigrants | Poland | 99.8 /100 | #48 | Exceptional 26.9% |
| Cambodians | 99.8 /100 | #49 | Exceptional 27.0% |
| Laotians | 99.8 /100 | #50 | Exceptional 27.0% |
| Immigrants | Argentina | 99.7 /100 | #51 | Exceptional 27.1% |
| Immigrants | South Eastern Asia | 99.7 /100 | #52 | Exceptional 27.1% |
| Immigrants | Jordan | 99.7 /100 | #53 | Exceptional 27.1% |
| Immigrants | Bulgaria | 99.7 /100 | #54 | Exceptional 27.1% |
| Immigrants | Egypt | 99.7 /100 | #55 | Exceptional 27.1% |
| Immigrants | Romania | 99.7 /100 | #56 | Exceptional 27.2% |
| Palestinians | 99.7 /100 | #57 | Exceptional 27.2% |
| Argentineans | 99.6 /100 | #58 | Exceptional 27.2% |
| Paraguayans | 99.6 /100 | #59 | Exceptional 27.2% |
| Eastern Europeans | 99.6 /100 | #60 | Exceptional 27.2% |