Jordanian vs Immigrants from Morocco Single Mother Poverty
COMPARE
Jordanian
Immigrants from Morocco
Single Mother Poverty
Single Mother Poverty Comparison
Jordanians
Immigrants from Morocco
26.4%
SINGLE MOTHER POVERTY
100.0/ 100
METRIC RATING
29th/ 347
METRIC RANK
28.4%
SINGLE MOTHER POVERTY
89.5/ 100
METRIC RATING
132nd/ 347
METRIC RANK
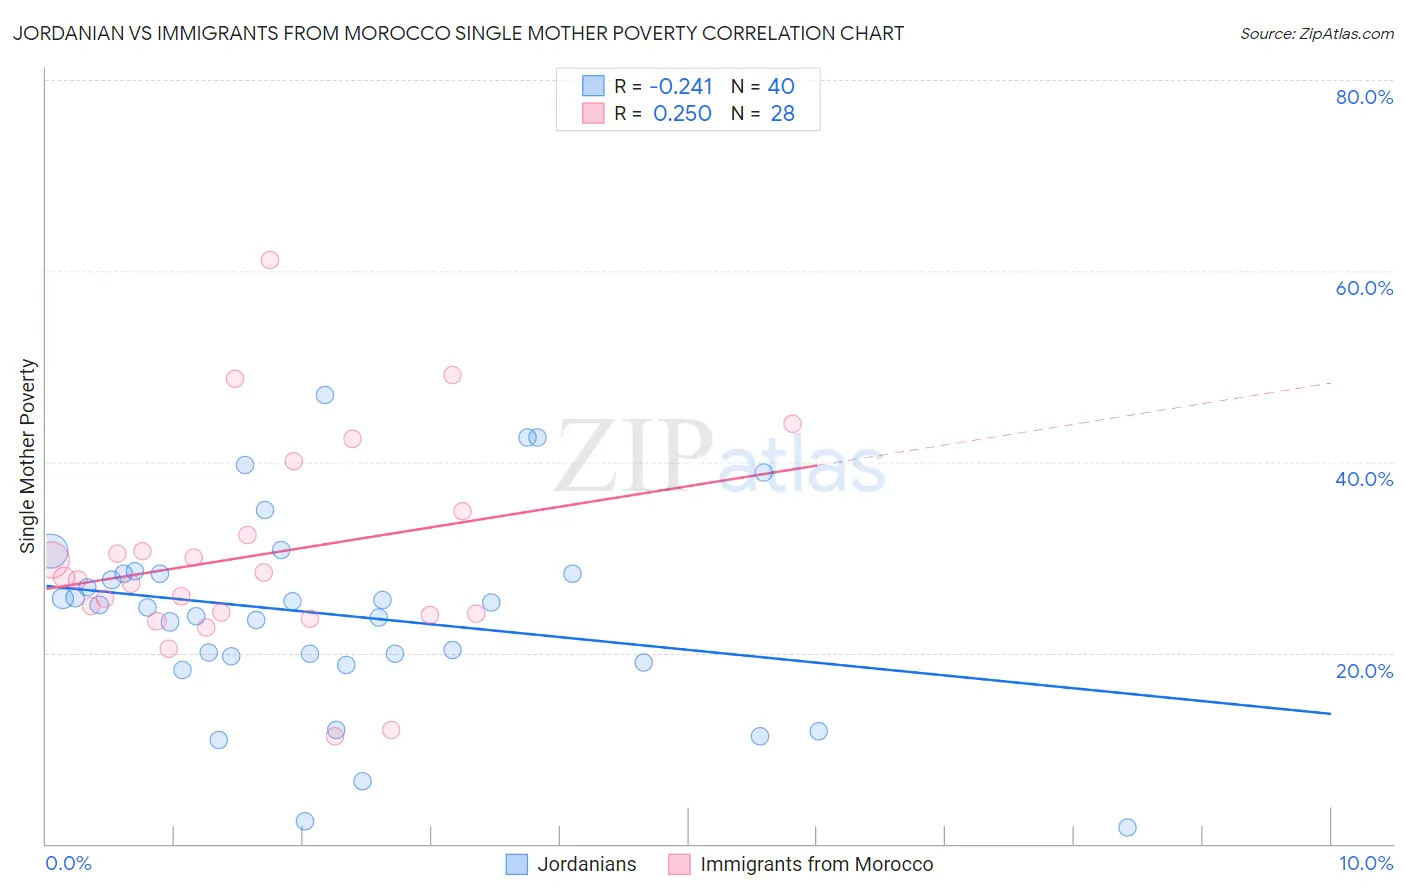
Jordanian vs Immigrants from Morocco Single Mother Poverty Correlation Chart
The statistical analysis conducted on geographies consisting of 164,762,978 people shows a weak negative correlation between the proportion of Jordanians and poverty level among single mothers in the United States with a correlation coefficient (R) of -0.241 and weighted average of 26.4%. Similarly, the statistical analysis conducted on geographies consisting of 176,937,771 people shows a weak positive correlation between the proportion of Immigrants from Morocco and poverty level among single mothers in the United States with a correlation coefficient (R) of 0.250 and weighted average of 28.4%, a difference of 7.6%.
Single Mother Poverty Correlation Summary
| Measurement | Jordanian | Immigrants from Morocco |
| Minimum | 1.7% | 11.2% |
| Maximum | 47.1% | 61.2% |
| Range | 45.4% | 49.9% |
| Mean | 24.0% | 30.2% |
| Median | 24.9% | 27.8% |
| Interquartile 25% (IQ1) | 19.3% | 24.0% |
| Interquartile 75% (IQ3) | 28.3% | 33.6% |
| Interquartile Range (IQR) | 9.0% | 9.6% |
| Standard Deviation (Sample) | 10.2% | 11.0% |
| Standard Deviation (Population) | 10.1% | 10.8% |
Similar Demographics by Single Mother Poverty
Demographics Similar to Jordanians by Single Mother Poverty
In terms of single mother poverty, the demographic groups most similar to Jordanians are Korean (26.4%, a difference of 0.050%), Immigrants from Japan (26.4%, a difference of 0.070%), Turkish (26.4%, a difference of 0.090%), Immigrants from Philippines (26.5%, a difference of 0.24%), and Immigrants from Sri Lanka (26.3%, a difference of 0.29%).
| Demographics | Rating | Rank | Single Mother Poverty |
| Immigrants | Korea | 100.0 /100 | #22 | Exceptional 26.2% |
| Burmese | 100.0 /100 | #23 | Exceptional 26.2% |
| Immigrants | Moldova | 100.0 /100 | #24 | Exceptional 26.2% |
| Immigrants | Asia | 100.0 /100 | #25 | Exceptional 26.3% |
| Immigrants | Sri Lanka | 100.0 /100 | #26 | Exceptional 26.3% |
| Immigrants | Japan | 100.0 /100 | #27 | Exceptional 26.4% |
| Koreans | 100.0 /100 | #28 | Exceptional 26.4% |
| Jordanians | 100.0 /100 | #29 | Exceptional 26.4% |
| Turks | 100.0 /100 | #30 | Exceptional 26.4% |
| Immigrants | Philippines | 100.0 /100 | #31 | Exceptional 26.5% |
| Tongans | 99.9 /100 | #32 | Exceptional 26.5% |
| Bulgarians | 99.9 /100 | #33 | Exceptional 26.5% |
| Immigrants | Indonesia | 99.9 /100 | #34 | Exceptional 26.6% |
| Maltese | 99.9 /100 | #35 | Exceptional 26.6% |
| Okinawans | 99.9 /100 | #36 | Exceptional 26.6% |
Demographics Similar to Immigrants from Morocco by Single Mother Poverty
In terms of single mother poverty, the demographic groups most similar to Immigrants from Morocco are Swedish (28.4%, a difference of 0.0%), Immigrants from Southern Europe (28.4%, a difference of 0.030%), Immigrants from Spain (28.4%, a difference of 0.030%), Native Hawaiian (28.4%, a difference of 0.070%), and Immigrants from Canada (28.4%, a difference of 0.070%).
| Demographics | Rating | Rank | Single Mother Poverty |
| Kenyans | 90.9 /100 | #125 | Exceptional 28.4% |
| Immigrants | Chile | 90.8 /100 | #126 | Exceptional 28.4% |
| Poles | 90.8 /100 | #127 | Exceptional 28.4% |
| Immigrants | England | 90.5 /100 | #128 | Exceptional 28.4% |
| South Americans | 90.4 /100 | #129 | Exceptional 28.4% |
| Norwegians | 90.4 /100 | #130 | Exceptional 28.4% |
| Immigrants | Austria | 90.3 /100 | #131 | Exceptional 28.4% |
| Immigrants | Morocco | 89.5 /100 | #132 | Excellent 28.4% |
| Swedes | 89.4 /100 | #133 | Excellent 28.4% |
| Immigrants | Southern Europe | 89.2 /100 | #134 | Excellent 28.4% |
| Immigrants | Spain | 89.2 /100 | #135 | Excellent 28.4% |
| Native Hawaiians | 88.9 /100 | #136 | Excellent 28.4% |
| Immigrants | Canada | 88.9 /100 | #137 | Excellent 28.4% |
| Immigrants | Belgium | 88.5 /100 | #138 | Excellent 28.5% |
| Samoans | 88.1 /100 | #139 | Excellent 28.5% |