Jordanian vs Immigrants from Armenia Single Mother Poverty
COMPARE
Jordanian
Immigrants from Armenia
Single Mother Poverty
Single Mother Poverty Comparison
Jordanians
Immigrants from Armenia
26.4%
SINGLE MOTHER POVERTY
100.0/ 100
METRIC RATING
29th/ 347
METRIC RANK
28.1%
SINGLE MOTHER POVERTY
95.2/ 100
METRIC RATING
109th/ 347
METRIC RANK
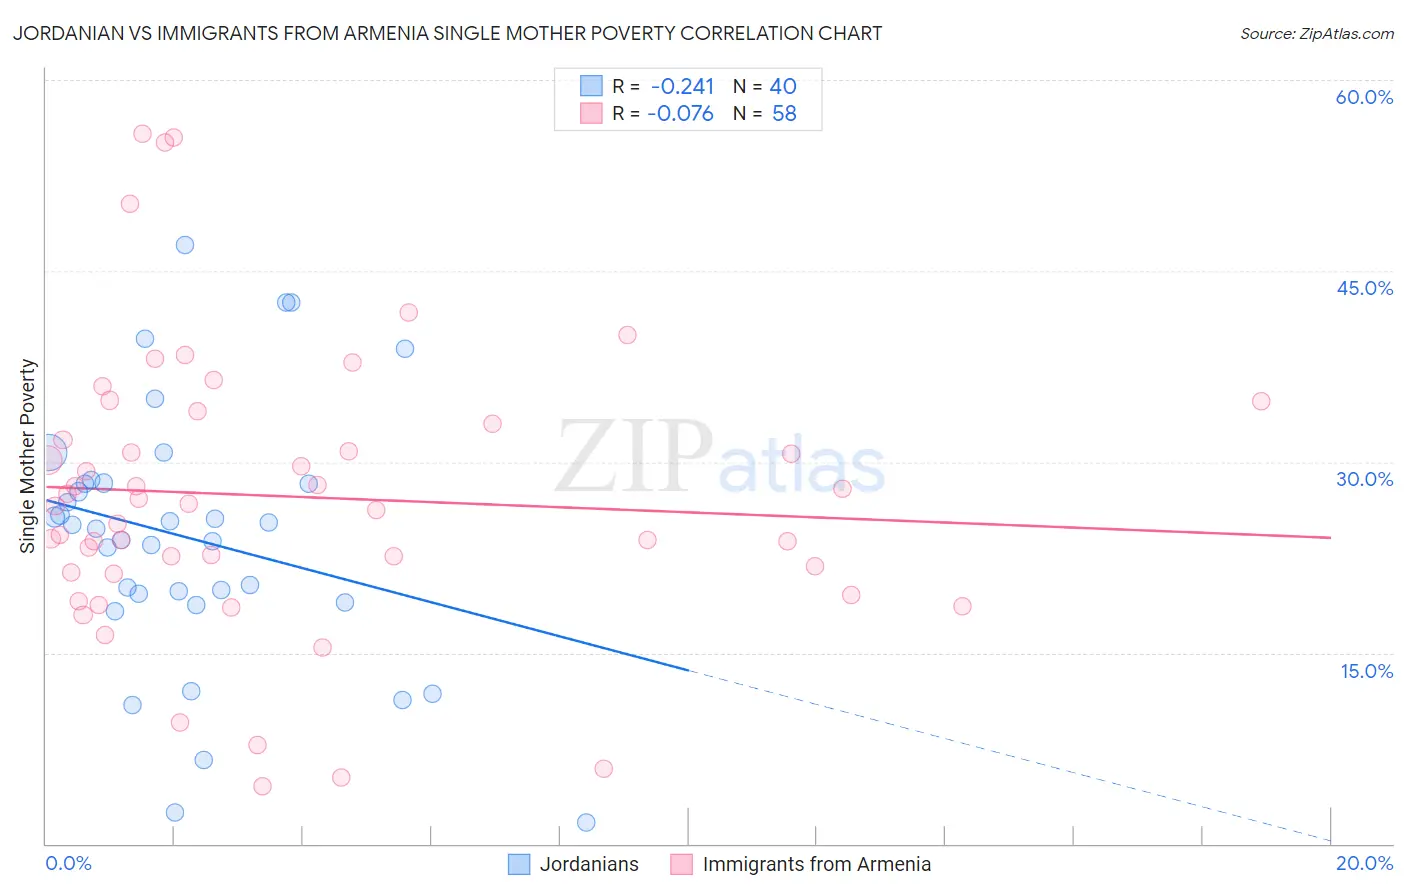
Jordanian vs Immigrants from Armenia Single Mother Poverty Correlation Chart
The statistical analysis conducted on geographies consisting of 164,762,978 people shows a weak negative correlation between the proportion of Jordanians and poverty level among single mothers in the United States with a correlation coefficient (R) of -0.241 and weighted average of 26.4%. Similarly, the statistical analysis conducted on geographies consisting of 96,611,895 people shows a slight negative correlation between the proportion of Immigrants from Armenia and poverty level among single mothers in the United States with a correlation coefficient (R) of -0.076 and weighted average of 28.1%, a difference of 6.5%.
Single Mother Poverty Correlation Summary
| Measurement | Jordanian | Immigrants from Armenia |
| Minimum | 1.7% | 4.5% |
| Maximum | 47.1% | 55.8% |
| Range | 45.4% | 51.3% |
| Mean | 24.0% | 27.3% |
| Median | 24.9% | 26.6% |
| Interquartile 25% (IQ1) | 19.3% | 21.3% |
| Interquartile 75% (IQ3) | 28.3% | 33.0% |
| Interquartile Range (IQR) | 9.0% | 11.7% |
| Standard Deviation (Sample) | 10.2% | 11.2% |
| Standard Deviation (Population) | 10.1% | 11.1% |
Similar Demographics by Single Mother Poverty
Demographics Similar to Jordanians by Single Mother Poverty
In terms of single mother poverty, the demographic groups most similar to Jordanians are Korean (26.4%, a difference of 0.050%), Immigrants from Japan (26.4%, a difference of 0.070%), Turkish (26.4%, a difference of 0.090%), Immigrants from Philippines (26.5%, a difference of 0.24%), and Immigrants from Sri Lanka (26.3%, a difference of 0.29%).
| Demographics | Rating | Rank | Single Mother Poverty |
| Immigrants | Korea | 100.0 /100 | #22 | Exceptional 26.2% |
| Burmese | 100.0 /100 | #23 | Exceptional 26.2% |
| Immigrants | Moldova | 100.0 /100 | #24 | Exceptional 26.2% |
| Immigrants | Asia | 100.0 /100 | #25 | Exceptional 26.3% |
| Immigrants | Sri Lanka | 100.0 /100 | #26 | Exceptional 26.3% |
| Immigrants | Japan | 100.0 /100 | #27 | Exceptional 26.4% |
| Koreans | 100.0 /100 | #28 | Exceptional 26.4% |
| Jordanians | 100.0 /100 | #29 | Exceptional 26.4% |
| Turks | 100.0 /100 | #30 | Exceptional 26.4% |
| Immigrants | Philippines | 100.0 /100 | #31 | Exceptional 26.5% |
| Tongans | 99.9 /100 | #32 | Exceptional 26.5% |
| Bulgarians | 99.9 /100 | #33 | Exceptional 26.5% |
| Immigrants | Indonesia | 99.9 /100 | #34 | Exceptional 26.6% |
| Maltese | 99.9 /100 | #35 | Exceptional 26.6% |
| Okinawans | 99.9 /100 | #36 | Exceptional 26.6% |
Demographics Similar to Immigrants from Armenia by Single Mother Poverty
In terms of single mother poverty, the demographic groups most similar to Immigrants from Armenia are Immigrants from Zimbabwe (28.1%, a difference of 0.090%), Croatian (28.2%, a difference of 0.12%), Immigrants from Venezuela (28.1%, a difference of 0.17%), Venezuelan (28.2%, a difference of 0.17%), and Immigrants from Kazakhstan (28.2%, a difference of 0.19%).
| Demographics | Rating | Rank | Single Mother Poverty |
| Immigrants | Croatia | 96.7 /100 | #102 | Exceptional 28.0% |
| Immigrants | Northern Africa | 96.6 /100 | #103 | Exceptional 28.0% |
| Italians | 96.6 /100 | #104 | Exceptional 28.0% |
| Israelis | 96.5 /100 | #105 | Exceptional 28.0% |
| Ukrainians | 96.4 /100 | #106 | Exceptional 28.0% |
| Immigrants | Venezuela | 95.8 /100 | #107 | Exceptional 28.1% |
| Immigrants | Zimbabwe | 95.5 /100 | #108 | Exceptional 28.1% |
| Immigrants | Armenia | 95.2 /100 | #109 | Exceptional 28.1% |
| Croatians | 94.8 /100 | #110 | Exceptional 28.2% |
| Venezuelans | 94.5 /100 | #111 | Exceptional 28.2% |
| Immigrants | Kazakhstan | 94.5 /100 | #112 | Exceptional 28.2% |
| Immigrants | South Africa | 93.2 /100 | #113 | Exceptional 28.3% |
| Immigrants | Western Asia | 92.7 /100 | #114 | Exceptional 28.3% |
| Immigrants | Kuwait | 92.7 /100 | #115 | Exceptional 28.3% |
| Immigrants | Uganda | 92.5 /100 | #116 | Exceptional 28.3% |