Peruvian vs Eastern European Single Mother Poverty
COMPARE
Peruvian
Eastern European
Single Mother Poverty
Single Mother Poverty Comparison
Peruvians
Eastern Europeans
27.5%
SINGLE MOTHER POVERTY
99.2/ 100
METRIC RATING
76th/ 347
METRIC RANK
27.2%
SINGLE MOTHER POVERTY
99.6/ 100
METRIC RATING
60th/ 347
METRIC RANK
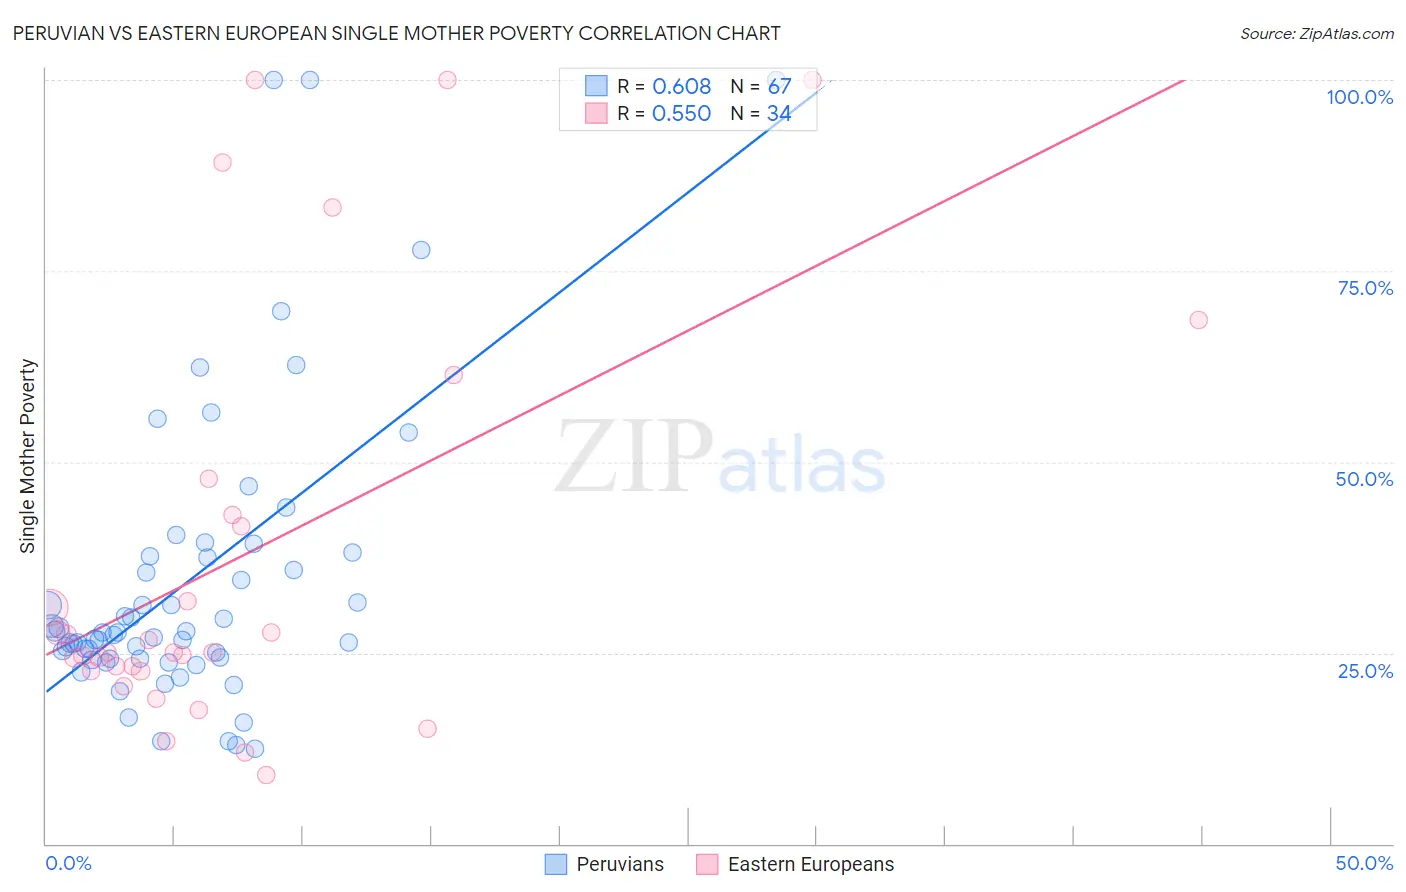
Peruvian vs Eastern European Single Mother Poverty Correlation Chart
The statistical analysis conducted on geographies consisting of 355,516,377 people shows a significant positive correlation between the proportion of Peruvians and poverty level among single mothers in the United States with a correlation coefficient (R) of 0.608 and weighted average of 27.5%. Similarly, the statistical analysis conducted on geographies consisting of 444,414,902 people shows a substantial positive correlation between the proportion of Eastern Europeans and poverty level among single mothers in the United States with a correlation coefficient (R) of 0.550 and weighted average of 27.2%, a difference of 1.0%.
Single Mother Poverty Correlation Summary
| Measurement | Peruvian | Eastern European |
| Minimum | 12.4% | 9.0% |
| Maximum | 100.0% | 100.0% |
| Range | 87.6% | 91.0% |
| Mean | 34.3% | 37.6% |
| Median | 27.6% | 25.1% |
| Interquartile 25% (IQ1) | 24.2% | 22.7% |
| Interquartile 75% (IQ3) | 37.7% | 43.0% |
| Interquartile Range (IQR) | 13.4% | 20.3% |
| Standard Deviation (Sample) | 19.4% | 27.1% |
| Standard Deviation (Population) | 19.2% | 26.7% |
Demographics Similar to Peruvians and Eastern Europeans by Single Mother Poverty
In terms of single mother poverty, the demographic groups most similar to Peruvians are Immigrants from Peru (27.5%, a difference of 0.020%), Immigrants from North Macedonia (27.5%, a difference of 0.030%), Immigrants from Sweden (27.5%, a difference of 0.040%), Immigrants from Europe (27.4%, a difference of 0.17%), and Sierra Leonean (27.4%, a difference of 0.24%). Similarly, the demographic groups most similar to Eastern Europeans are Paraguayan (27.2%, a difference of 0.040%), Argentinean (27.2%, a difference of 0.050%), Immigrants from Eastern Europe (27.2%, a difference of 0.11%), Immigrants from Malaysia (27.3%, a difference of 0.25%), and Immigrants from Northern Europe (27.3%, a difference of 0.29%).
| Demographics | Rating | Rank | Single Mother Poverty |
| Argentineans | 99.6 /100 | #58 | Exceptional 27.2% |
| Paraguayans | 99.6 /100 | #59 | Exceptional 27.2% |
| Eastern Europeans | 99.6 /100 | #60 | Exceptional 27.2% |
| Immigrants | Eastern Europe | 99.6 /100 | #61 | Exceptional 27.2% |
| Immigrants | Malaysia | 99.5 /100 | #62 | Exceptional 27.3% |
| Immigrants | Northern Europe | 99.5 /100 | #63 | Exceptional 27.3% |
| Russians | 99.5 /100 | #64 | Exceptional 27.3% |
| Immigrants | Turkey | 99.5 /100 | #65 | Exceptional 27.3% |
| Soviet Union | 99.5 /100 | #66 | Exceptional 27.3% |
| Immigrants | Australia | 99.5 /100 | #67 | Exceptional 27.3% |
| Immigrants | Czechoslovakia | 99.5 /100 | #68 | Exceptional 27.4% |
| Lithuanians | 99.4 /100 | #69 | Exceptional 27.4% |
| Immigrants | Belarus | 99.4 /100 | #70 | Exceptional 27.4% |
| Macedonians | 99.4 /100 | #71 | Exceptional 27.4% |
| Immigrants | Russia | 99.4 /100 | #72 | Exceptional 27.4% |
| Sierra Leoneans | 99.3 /100 | #73 | Exceptional 27.4% |
| Immigrants | Europe | 99.3 /100 | #74 | Exceptional 27.4% |
| Immigrants | Sweden | 99.2 /100 | #75 | Exceptional 27.5% |
| Peruvians | 99.2 /100 | #76 | Exceptional 27.5% |
| Immigrants | Peru | 99.2 /100 | #77 | Exceptional 27.5% |
| Immigrants | North Macedonia | 99.2 /100 | #78 | Exceptional 27.5% |