Immigrants from Grenada vs Colombian Single Mother Poverty
COMPARE
Immigrants from Grenada
Colombian
Single Mother Poverty
Single Mother Poverty Comparison
Immigrants from Grenada
Colombians
30.3%
SINGLE MOTHER POVERTY
3.4/ 100
METRIC RATING
235th/ 347
METRIC RANK
28.3%
SINGLE MOTHER POVERTY
91.8/ 100
METRIC RATING
122nd/ 347
METRIC RANK
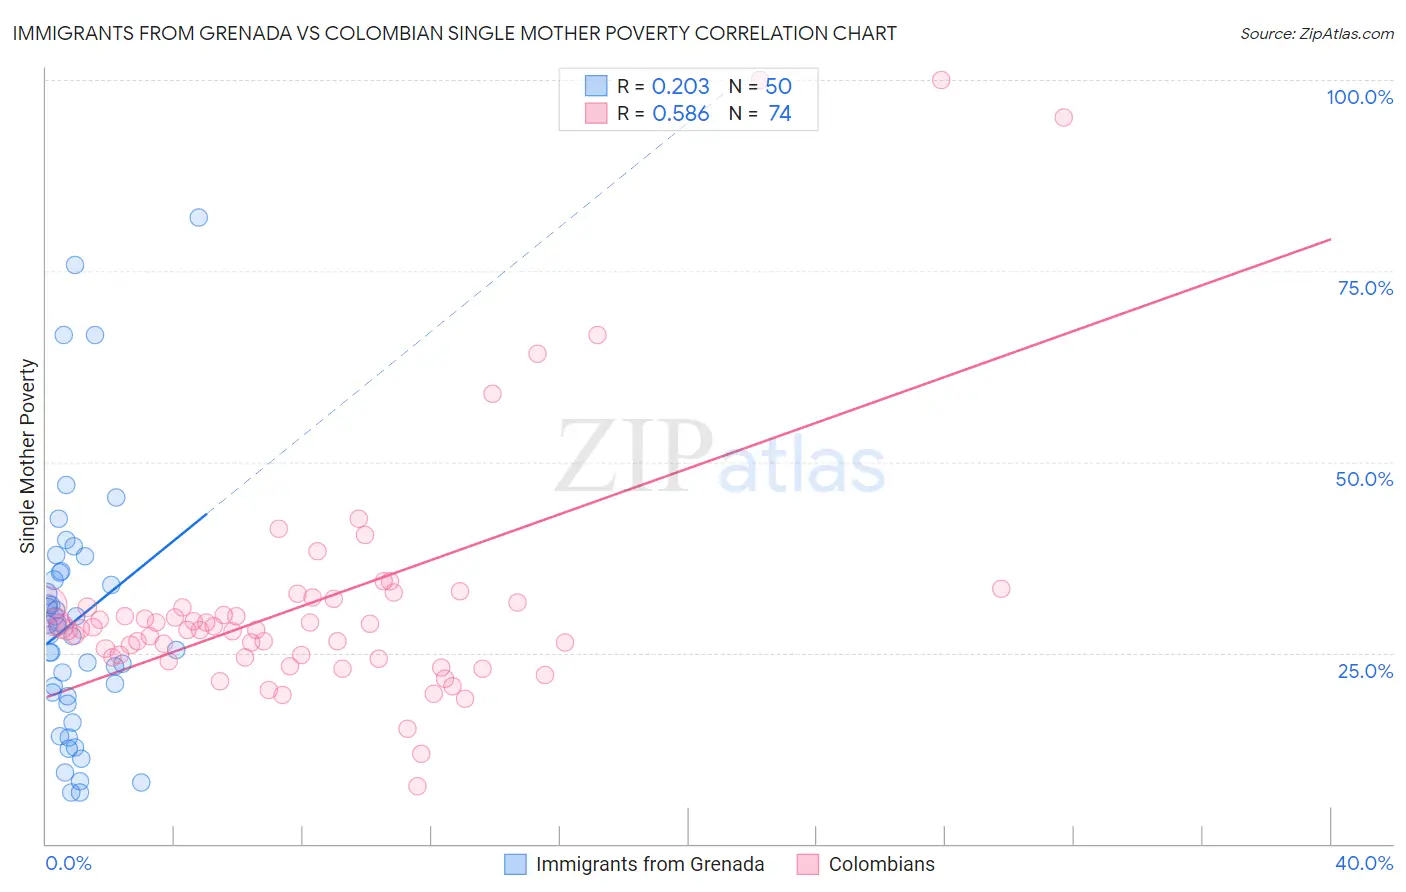
Immigrants from Grenada vs Colombian Single Mother Poverty Correlation Chart
The statistical analysis conducted on geographies consisting of 66,826,476 people shows a weak positive correlation between the proportion of Immigrants from Grenada and poverty level among single mothers in the United States with a correlation coefficient (R) of 0.203 and weighted average of 30.3%. Similarly, the statistical analysis conducted on geographies consisting of 409,096,293 people shows a substantial positive correlation between the proportion of Colombians and poverty level among single mothers in the United States with a correlation coefficient (R) of 0.586 and weighted average of 28.3%, a difference of 7.1%.
Single Mother Poverty Correlation Summary
| Measurement | Immigrants from Grenada | Colombian |
| Minimum | 6.6% | 7.6% |
| Maximum | 82.1% | 100.0% |
| Range | 75.4% | 92.4% |
| Mean | 29.3% | 31.7% |
| Median | 27.9% | 28.2% |
| Interquartile 25% (IQ1) | 19.2% | 24.4% |
| Interquartile 75% (IQ3) | 35.5% | 31.6% |
| Interquartile Range (IQR) | 16.3% | 7.2% |
| Standard Deviation (Sample) | 16.6% | 16.6% |
| Standard Deviation (Population) | 16.4% | 16.5% |
Similar Demographics by Single Mother Poverty
Demographics Similar to Immigrants from Grenada by Single Mother Poverty
In terms of single mother poverty, the demographic groups most similar to Immigrants from Grenada are Immigrants from Middle Africa (30.3%, a difference of 0.030%), Immigrants from Nicaragua (30.3%, a difference of 0.030%), Welsh (30.4%, a difference of 0.070%), Immigrants from St. Vincent and the Grenadines (30.4%, a difference of 0.12%), and Slovak (30.4%, a difference of 0.23%).
| Demographics | Rating | Rank | Single Mother Poverty |
| Spaniards | 5.4 /100 | #228 | Tragic 30.2% |
| Immigrants | Barbados | 5.0 /100 | #229 | Tragic 30.2% |
| English | 4.8 /100 | #230 | Tragic 30.2% |
| Dutch | 4.3 /100 | #231 | Tragic 30.2% |
| Alaskan Athabascans | 4.1 /100 | #232 | Tragic 30.3% |
| Immigrants | Middle Africa | 3.5 /100 | #233 | Tragic 30.3% |
| Immigrants | Nicaragua | 3.5 /100 | #234 | Tragic 30.3% |
| Immigrants | Grenada | 3.4 /100 | #235 | Tragic 30.3% |
| Welsh | 3.2 /100 | #236 | Tragic 30.4% |
| Immigrants | St. Vincent and the Grenadines | 3.1 /100 | #237 | Tragic 30.4% |
| Slovaks | 2.8 /100 | #238 | Tragic 30.4% |
| Immigrants | Portugal | 2.1 /100 | #239 | Tragic 30.5% |
| Salvadorans | 1.8 /100 | #240 | Tragic 30.6% |
| Immigrants | Laos | 1.8 /100 | #241 | Tragic 30.6% |
| Immigrants | Burma/Myanmar | 1.7 /100 | #242 | Tragic 30.6% |
Demographics Similar to Colombians by Single Mother Poverty
In terms of single mother poverty, the demographic groups most similar to Colombians are Uruguayan (28.3%, a difference of 0.010%), Immigrants from Switzerland (28.3%, a difference of 0.010%), Immigrants from Afghanistan (28.3%, a difference of 0.050%), Cypriot (28.3%, a difference of 0.090%), and Immigrants from Syria (28.3%, a difference of 0.10%).
| Demographics | Rating | Rank | Single Mother Poverty |
| Immigrants | Kuwait | 92.7 /100 | #115 | Exceptional 28.3% |
| Immigrants | Uganda | 92.5 /100 | #116 | Exceptional 28.3% |
| Australians | 92.5 /100 | #117 | Exceptional 28.3% |
| Brazilians | 92.4 /100 | #118 | Exceptional 28.3% |
| Immigrants | Syria | 92.4 /100 | #119 | Exceptional 28.3% |
| Cypriots | 92.3 /100 | #120 | Exceptional 28.3% |
| Immigrants | Afghanistan | 92.1 /100 | #121 | Exceptional 28.3% |
| Colombians | 91.8 /100 | #122 | Exceptional 28.3% |
| Uruguayans | 91.7 /100 | #123 | Exceptional 28.3% |
| Immigrants | Switzerland | 91.7 /100 | #124 | Exceptional 28.3% |
| Kenyans | 90.9 /100 | #125 | Exceptional 28.4% |
| Immigrants | Chile | 90.8 /100 | #126 | Exceptional 28.4% |
| Poles | 90.8 /100 | #127 | Exceptional 28.4% |
| Immigrants | England | 90.5 /100 | #128 | Exceptional 28.4% |
| South Americans | 90.4 /100 | #129 | Exceptional 28.4% |