Israeli vs Immigrants from Croatia Single Mother Poverty

COMPARE

Israeli
Race
Ancestry
AfghanAfricanAlaska NativeAlaskan AthabascanAlbanianAleutAlsatianAmericanApacheArabArapahoArgentineanArmenianAssyrian/Chaldean/SyriacAustralianAustrianBahamianBangladeshiBarbadianBasqueBelgianBelizeanBermudanBhutaneseBlackfeetBolivianBrazilianBritishBritish West IndianBulgarianBurmeseCajunCambodianCanadianCape VerdeanCarpatho RusynCelticCentral AmericanCentral American IndianCherokeeCheyenneChickasawChileanChineseChippewaChoctawColombianColvilleComancheCosta RicanCreeCreekCroatianCrowCubanCypriotCzechCzechoslovakianDanishDelawareDominicanDutchDutch West IndianEastern EuropeanEcuadorianEgyptianEnglishEstonianEthiopianEuropeanFijianFilipinoFinnishFrenchFrench American IndianFrench CanadianGermanGerman RussianGhanaianGreekGuamanian/ChamorroGuatemalanGuyaneseHaitianHmongHonduranHopiHoumaHungarianIcelanderIndian (Asian)IndonesianInupiatIranianIraqiIrishIroquoisIsraeliItalianJamaicanJapaneseJordanianKenyanKiowaKoreanLaotianLatvianLebaneseLiberianLithuanianLumbeeLuxembourgerMacedonianMalaysianMalteseMarshalleseMenomineeMexicanMexican American IndianMongolianMoroccanNative HawaiianNavajoNepaleseNew ZealanderNicaraguanNigerianNorthern EuropeanNorwegianOkinawanOsageOttawaPaiutePakistaniPalestinianPanamanianParaguayanPennsylvania GermanPeruvianPimaPolishPortuguesePotawatomiPuebloPuerto RicanPuget Sound SalishRomanianRussianSalvadoranSamoanScandinavianScotch-IrishScottishSeminoleSenegaleseSerbianShoshoneSierra LeoneanSiouxSlavicSlovakSloveneSomaliSouth AfricanSouth AmericanSouth American IndianSoviet UnionSpaniardSpanishSpanish AmericanSpanish American IndianSri LankanSubsaharan AfricanSudaneseSwedishSwissSyrianTaiwaneseThaiTlingit-HaidaTohono O'OdhamTonganTrinidadian and TobagonianTsimshianTurkishU.S. Virgin IslanderUgandanUkrainianUruguayanUteVenezuelanVietnameseWelshWest IndianYakamaYaquiYugoslavianYumanYup'ikZimbabwean
Immigration
NonimmigrantsImmigrantsAfghanistanAfricaAlbaniaArgentinaArmeniaAsiaAustraliaAustriaBahamasBangladeshBarbadosBelarusBelgiumBelizeBoliviaBosnia and HerzegovinaBrazilBulgariaBurma/MyanmarCabo VerdeCambodiaCameroonCanadaCaribbeanCentral AmericaChileChinaColombiaCongoCosta RicaCubaCzechoslovakiaDenmarkDominicaDominican RepublicEastern AfricaEastern AsiaEastern EuropeEcuadorEgyptEl SalvadorEnglandEritreaEthiopiaEuropeFijiFranceGermanyGhanaGreeceGrenadaGuatemalaGuyanaHaitiHondurasHong KongHungaryIndiaIndonesiaIranIraqIrelandIsraelItalyJamaicaJapanJordanKazakhstanKenyaKoreaKuwaitLaosLatin AmericaLatviaLebanonLiberiaLithuaniaMalaysiaMexicoMicronesiaMiddle AfricaMoldovaMoroccoNepalNetherlandsNicaraguaNigeriaNorth AmericaNorth MacedoniaNorthern AfricaNorthern EuropeNorwayOceaniaPakistanPanamaPeruPhilippinesPolandPortugalRomaniaRussiaSaudi ArabiaScotlandSenegalSerbiaSierra LeoneSingaporeSomaliaSouth AfricaSouth AmericaSouth Central AsiaSouth Eastern AsiaSouthern EuropeSpainSri LankaSt. Vincent and the GrenadinesSudanSwedenSwitzerlandSyriaTaiwanThailandTrinidad and TobagoTurkeyUgandaUkraineUruguayUzbekistanVenezuelaVietnamWest IndiesWestern AfricaWestern AsiaWestern EuropeYemenZaireZimbabweAzores
Immigrants from Croatia
Race
Ancestry
AfghanAfricanAlaska NativeAlaskan AthabascanAlbanianAleutAlsatianAmericanApacheArabArapahoArgentineanArmenianAssyrian/Chaldean/SyriacAustralianAustrianBahamianBangladeshiBarbadianBasqueBelgianBelizeanBermudanBhutaneseBlackfeetBolivianBrazilianBritishBritish West IndianBulgarianBurmeseCajunCambodianCanadianCape VerdeanCarpatho RusynCelticCentral AmericanCentral American IndianCherokeeCheyenneChickasawChileanChineseChippewaChoctawColombianColvilleComancheCosta RicanCreeCreekCroatianCrowCubanCypriotCzechCzechoslovakianDanishDelawareDominicanDutchDutch West IndianEastern EuropeanEcuadorianEgyptianEnglishEstonianEthiopianEuropeanFijianFilipinoFinnishFrenchFrench American IndianFrench CanadianGermanGerman RussianGhanaianGreekGuamanian/ChamorroGuatemalanGuyaneseHaitianHmongHonduranHopiHoumaHungarianIcelanderIndian (Asian)IndonesianInupiatIranianIraqiIrishIroquoisItalianJamaicanJapaneseJordanianKenyanKiowaKoreanLaotianLatvianLebaneseLiberianLithuanianLumbeeLuxembourgerMacedonianMalaysianMalteseMarshalleseMenomineeMexicanMexican American IndianMongolianMoroccanNative HawaiianNavajoNepaleseNew ZealanderNicaraguanNigerianNorthern EuropeanNorwegianOkinawanOsageOttawaPaiutePakistaniPalestinianPanamanianParaguayanPennsylvania GermanPeruvianPimaPolishPortuguesePotawatomiPuebloPuerto RicanPuget Sound SalishRomanianRussianSalvadoranSamoanScandinavianScotch-IrishScottishSeminoleSenegaleseSerbianShoshoneSierra LeoneanSiouxSlavicSlovakSloveneSomaliSouth AfricanSouth AmericanSouth American IndianSoviet UnionSpaniardSpanishSpanish AmericanSpanish American IndianSri LankanSubsaharan AfricanSudaneseSwedishSwissSyrianTaiwaneseThaiTlingit-HaidaTohono O'OdhamTonganTrinidadian and TobagonianTsimshianTurkishU.S. Virgin IslanderUgandanUkrainianUruguayanUteVenezuelanVietnameseWelshWest IndianYakamaYaquiYugoslavianYumanYup'ikZimbabwean
Immigration
NonimmigrantsImmigrantsAfghanistanAfricaAlbaniaArgentinaArmeniaAsiaAustraliaAustriaBahamasBangladeshBarbadosBelarusBelgiumBelizeBoliviaBosnia and HerzegovinaBrazilBulgariaBurma/MyanmarCabo VerdeCambodiaCameroonCanadaCaribbeanCentral AmericaChileChinaColombiaCongoCosta RicaCroatiaCubaCzechoslovakiaDenmarkDominicaDominican RepublicEastern AfricaEastern AsiaEastern EuropeEcuadorEgyptEl SalvadorEnglandEritreaEthiopiaEuropeFijiFranceGermanyGhanaGreeceGrenadaGuatemalaGuyanaHaitiHondurasHong KongHungaryIndiaIndonesiaIranIraqIrelandIsraelItalyJamaicaJapanJordanKazakhstanKenyaKoreaKuwaitLaosLatin AmericaLatviaLebanonLiberiaLithuaniaMalaysiaMexicoMicronesiaMiddle AfricaMoldovaMoroccoNepalNetherlandsNicaraguaNigeriaNorth AmericaNorth MacedoniaNorthern AfricaNorthern EuropeNorwayOceaniaPakistanPanamaPeruPhilippinesPolandPortugalRomaniaRussiaSaudi ArabiaScotlandSenegalSerbiaSierra LeoneSingaporeSomaliaSouth AfricaSouth AmericaSouth Central AsiaSouth Eastern AsiaSouthern EuropeSpainSri LankaSt. Vincent and the GrenadinesSudanSwedenSwitzerlandSyriaTaiwanThailandTrinidad and TobagoTurkeyUgandaUkraineUruguayUzbekistanVenezuelaVietnamWest IndiesWestern AfricaWestern AsiaWestern EuropeYemenZaireZimbabweAzores
Single Mother Poverty
Income
Poverty
Unemployment
Labor Participation
Family Structure
Vehicle Availability
Education Level
Disability

Single Mother Poverty Comparison

Israelis

Immigrants from Croatia

Exceptional
Exceptional
28.0%
SINGLE MOTHER POVERTY
96.5/ 100
METRIC RATING
105th/ 347
METRIC RANK
28.0%
SINGLE MOTHER POVERTY
96.7/ 100
METRIC RATING
102nd/ 347
METRIC RANK

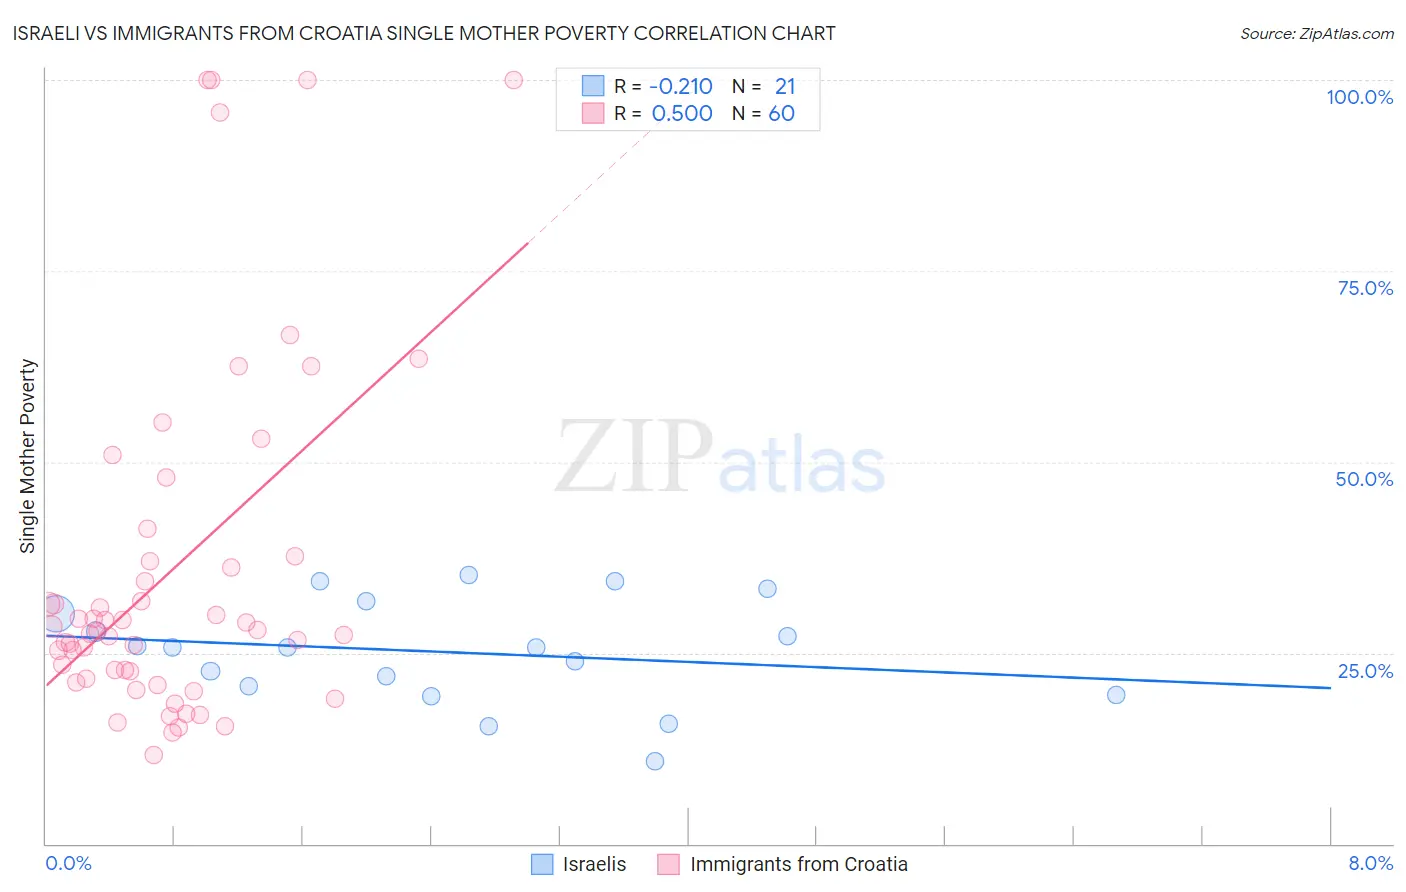
Israeli vs Immigrants from Croatia Single Mother Poverty Correlation Chart

The statistical analysis conducted on geographies consisting of 207,028,427 people shows a weak negative correlation between the proportion of Israelis and poverty level among single mothers in the United States with a correlation coefficient (R) of -0.210 and weighted average of 28.0%. Similarly, the statistical analysis conducted on geographies consisting of 130,792,597 people shows a moderate positive correlation between the proportion of Immigrants from Croatia and poverty level among single mothers in the United States with a correlation coefficient (R) of 0.500 and weighted average of 28.0%, a difference of 0.060%.
Israeli vs Immigrants from Croatia Single Mother Poverty

Single Mother Poverty Correlation Summary

MeasurementIsraeliImmigrants from Croatia
Minimum10.8%11.6%
Maximum35.2%100.0%
Range24.4%88.4%
Mean25.1%35.8%
Median25.6%27.9%
Interquartile 25% (IQ1)20.1%22.2%
Interquartile 75% (IQ3)31.0%37.3%
Interquartile Range (IQR)10.9%15.1%
Standard Deviation (Sample)6.8%23.1%
Standard Deviation (Population)6.6%22.9%

Demographics Similar to Israelis and Immigrants from Croatia by Single Mother Poverty

In terms of single mother poverty, the demographic groups most similar to Israelis are Italian (28.0%, a difference of 0.020%), Immigrants from Northern Africa (28.0%, a difference of 0.040%), Ukrainian (28.0%, a difference of 0.040%), Pakistani (28.0%, a difference of 0.16%), and Zimbabwean (27.9%, a difference of 0.23%). Similarly, the demographic groups most similar to Immigrants from Croatia are Immigrants from Northern Africa (28.0%, a difference of 0.020%), Italian (28.0%, a difference of 0.030%), Pakistani (28.0%, a difference of 0.10%), Ukrainian (28.0%, a difference of 0.10%), and Zimbabwean (27.9%, a difference of 0.17%).
DemographicsRating | RankSingle Mother Poverty
Romanians
97.8
/100
|
#93
Exceptional
27.8%
Albanians
97.6
/100
|
#94
Exceptional
27.9%
Chileans
97.5
/100
|
#95
Exceptional
27.9%
Immigrants | Iraq
97.3
/100
|
#96
Exceptional
27.9%
Immigrants | Brazil
97.2
/100
|
#97
Exceptional
27.9%
Immigrants | Nepal
97.2
/100
|
#98
Exceptional
27.9%
Immigrants | Netherlands
97.2
/100
|
#99
Exceptional
27.9%
Zimbabweans
97.1
/100
|
#100
Exceptional
27.9%
Pakistanis
96.9
/100
|
#101
Exceptional
28.0%
Immigrants | Croatia
96.7
/100
|
#102
Exceptional
28.0%
Immigrants | Northern Africa
96.6
/100
|
#103
Exceptional
28.0%
Italians
96.6
/100
|
#104
Exceptional
28.0%
Israelis
96.5
/100
|
#105
Exceptional
28.0%
Ukrainians
96.4
/100
|
#106
Exceptional
28.0%
Immigrants | Venezuela
95.8
/100
|
#107
Exceptional
28.1%
Immigrants | Zimbabwe
95.5
/100
|
#108
Exceptional
28.1%
Immigrants | Armenia
95.2
/100
|
#109
Exceptional
28.1%
Croatians
94.8
/100
|
#110
Exceptional
28.2%
Venezuelans
94.5
/100
|
#111
Exceptional
28.2%
Immigrants | Kazakhstan
94.5
/100
|
#112
Exceptional
28.2%
Immigrants | South Africa
93.2
/100
|
#113
Exceptional
28.3%