Israeli vs Immigrants from Africa Single Mother Poverty
COMPARE
Israeli
Immigrants from Africa
Single Mother Poverty
Single Mother Poverty Comparison
Israelis
Immigrants from Africa
28.0%
SINGLE MOTHER POVERTY
96.5/ 100
METRIC RATING
105th/ 347
METRIC RANK
29.4%
SINGLE MOTHER POVERTY
31.6/ 100
METRIC RATING
189th/ 347
METRIC RANK
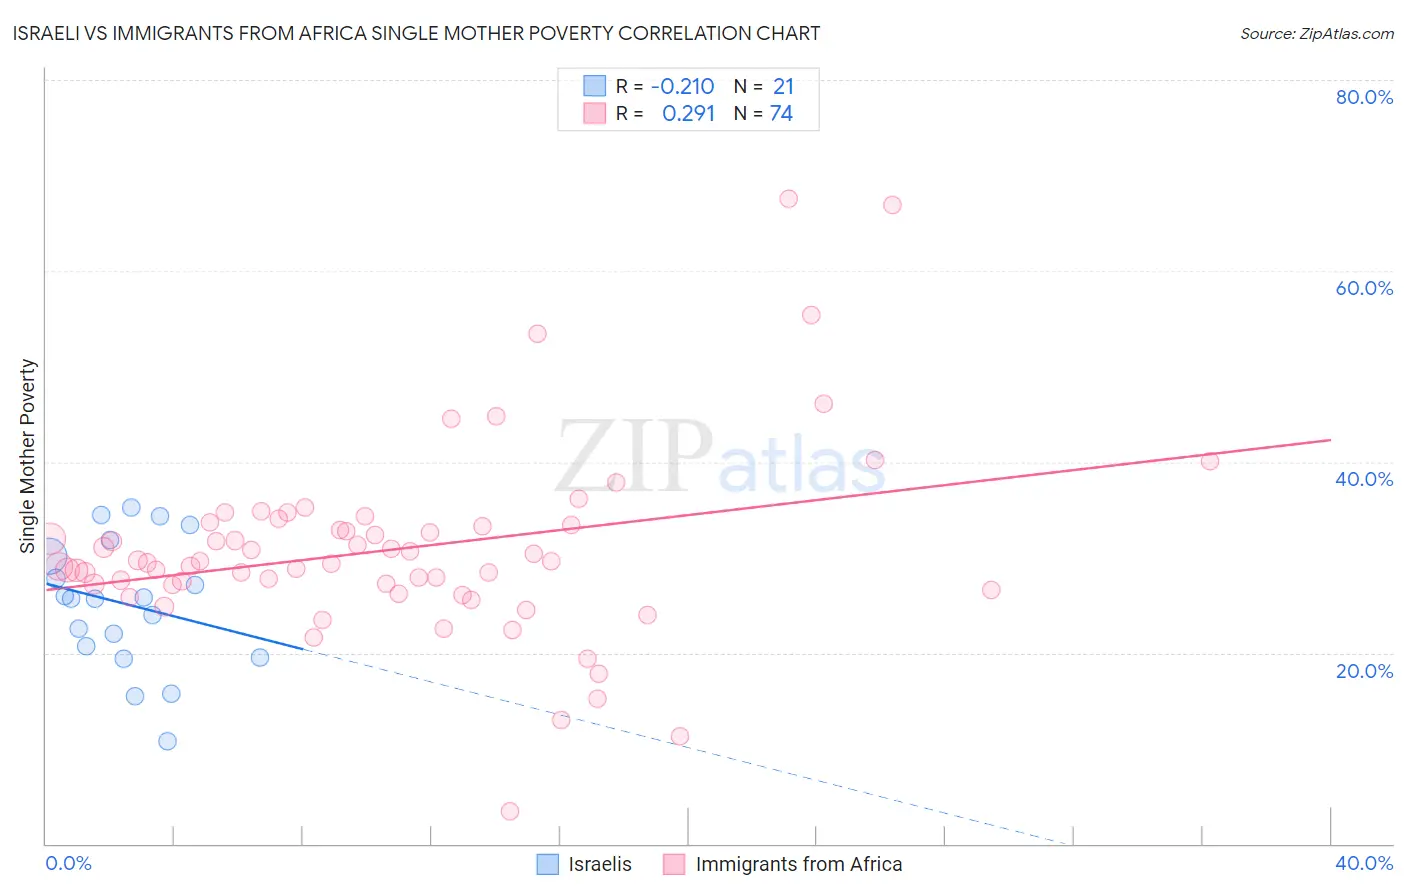
Israeli vs Immigrants from Africa Single Mother Poverty Correlation Chart
The statistical analysis conducted on geographies consisting of 207,028,427 people shows a weak negative correlation between the proportion of Israelis and poverty level among single mothers in the United States with a correlation coefficient (R) of -0.210 and weighted average of 28.0%. Similarly, the statistical analysis conducted on geographies consisting of 456,007,162 people shows a weak positive correlation between the proportion of Immigrants from Africa and poverty level among single mothers in the United States with a correlation coefficient (R) of 0.291 and weighted average of 29.4%, a difference of 5.1%.
Single Mother Poverty Correlation Summary
| Measurement | Israeli | Immigrants from Africa |
| Minimum | 10.8% | 3.4% |
| Maximum | 35.2% | 67.6% |
| Range | 24.4% | 64.1% |
| Mean | 25.1% | 30.9% |
| Median | 25.6% | 29.5% |
| Interquartile 25% (IQ1) | 20.1% | 27.1% |
| Interquartile 75% (IQ3) | 31.0% | 33.3% |
| Interquartile Range (IQR) | 10.9% | 6.3% |
| Standard Deviation (Sample) | 6.8% | 10.1% |
| Standard Deviation (Population) | 6.6% | 10.0% |
Similar Demographics by Single Mother Poverty
Demographics Similar to Israelis by Single Mother Poverty
In terms of single mother poverty, the demographic groups most similar to Israelis are Italian (28.0%, a difference of 0.020%), Immigrants from Northern Africa (28.0%, a difference of 0.040%), Ukrainian (28.0%, a difference of 0.040%), Immigrants from Croatia (28.0%, a difference of 0.060%), and Pakistani (28.0%, a difference of 0.16%).
| Demographics | Rating | Rank | Single Mother Poverty |
| Immigrants | Nepal | 97.2 /100 | #98 | Exceptional 27.9% |
| Immigrants | Netherlands | 97.2 /100 | #99 | Exceptional 27.9% |
| Zimbabweans | 97.1 /100 | #100 | Exceptional 27.9% |
| Pakistanis | 96.9 /100 | #101 | Exceptional 28.0% |
| Immigrants | Croatia | 96.7 /100 | #102 | Exceptional 28.0% |
| Immigrants | Northern Africa | 96.6 /100 | #103 | Exceptional 28.0% |
| Italians | 96.6 /100 | #104 | Exceptional 28.0% |
| Israelis | 96.5 /100 | #105 | Exceptional 28.0% |
| Ukrainians | 96.4 /100 | #106 | Exceptional 28.0% |
| Immigrants | Venezuela | 95.8 /100 | #107 | Exceptional 28.1% |
| Immigrants | Zimbabwe | 95.5 /100 | #108 | Exceptional 28.1% |
| Immigrants | Armenia | 95.2 /100 | #109 | Exceptional 28.1% |
| Croatians | 94.8 /100 | #110 | Exceptional 28.2% |
| Venezuelans | 94.5 /100 | #111 | Exceptional 28.2% |
| Immigrants | Kazakhstan | 94.5 /100 | #112 | Exceptional 28.2% |
Demographics Similar to Immigrants from Africa by Single Mother Poverty
In terms of single mother poverty, the demographic groups most similar to Immigrants from Africa are Guamanian/Chamorro (29.4%, a difference of 0.010%), Lebanese (29.4%, a difference of 0.050%), Immigrants from Germany (29.5%, a difference of 0.070%), Immigrants from Trinidad and Tobago (29.5%, a difference of 0.13%), and Moroccan (29.5%, a difference of 0.17%).
| Demographics | Rating | Rank | Single Mother Poverty |
| Immigrants | Eastern Africa | 38.5 /100 | #182 | Fair 29.3% |
| Nepalese | 38.3 /100 | #183 | Fair 29.3% |
| Nigerians | 38.0 /100 | #184 | Fair 29.3% |
| Ghanaians | 36.8 /100 | #185 | Fair 29.4% |
| Yugoslavians | 36.0 /100 | #186 | Fair 29.4% |
| Lebanese | 32.5 /100 | #187 | Fair 29.4% |
| Guamanians/Chamorros | 31.8 /100 | #188 | Fair 29.4% |
| Immigrants | Africa | 31.6 /100 | #189 | Fair 29.4% |
| Immigrants | Germany | 30.4 /100 | #190 | Fair 29.5% |
| Immigrants | Trinidad and Tobago | 29.2 /100 | #191 | Fair 29.5% |
| Moroccans | 28.6 /100 | #192 | Fair 29.5% |
| Basques | 28.3 /100 | #193 | Fair 29.5% |
| Icelanders | 26.1 /100 | #194 | Fair 29.5% |
| Slavs | 24.5 /100 | #195 | Fair 29.6% |
| Spanish American Indians | 23.4 /100 | #196 | Fair 29.6% |