Immigrants from Nigeria vs Immigrants from Bahamas Family Poverty
COMPARE
Immigrants from Nigeria
Immigrants from Bahamas
Family Poverty
Family Poverty Comparison
Immigrants from Nigeria
Immigrants from Bahamas
10.2%
FAMILY POVERTY
1.9/ 100
METRIC RATING
236th/ 347
METRIC RANK
11.1%
FAMILY POVERTY
0.1/ 100
METRIC RATING
271st/ 347
METRIC RANK
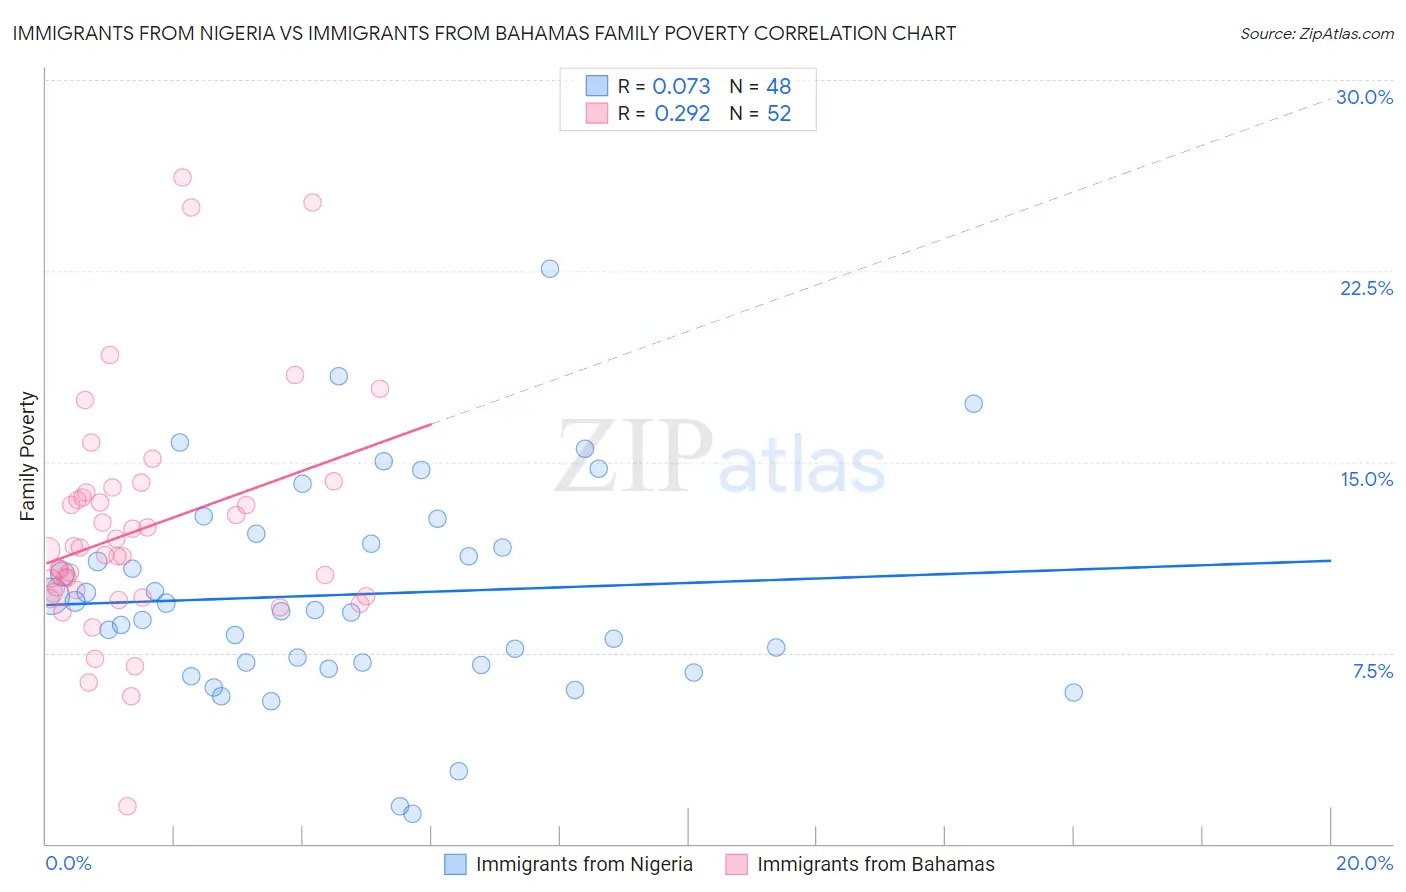
Immigrants from Nigeria vs Immigrants from Bahamas Family Poverty Correlation Chart
The statistical analysis conducted on geographies consisting of 283,018,314 people shows a slight positive correlation between the proportion of Immigrants from Nigeria and poverty level among families in the United States with a correlation coefficient (R) of 0.073 and weighted average of 10.2%. Similarly, the statistical analysis conducted on geographies consisting of 104,583,559 people shows a weak positive correlation between the proportion of Immigrants from Bahamas and poverty level among families in the United States with a correlation coefficient (R) of 0.292 and weighted average of 11.1%, a difference of 9.5%.
Family Poverty Correlation Summary
| Measurement | Immigrants from Nigeria | Immigrants from Bahamas |
| Minimum | 1.2% | 1.5% |
| Maximum | 22.6% | 26.2% |
| Range | 21.4% | 24.7% |
| Mean | 9.8% | 12.3% |
| Median | 9.2% | 11.4% |
| Interquartile 25% (IQ1) | 7.1% | 9.8% |
| Interquartile 75% (IQ3) | 12.0% | 13.7% |
| Interquartile Range (IQR) | 4.9% | 3.9% |
| Standard Deviation (Sample) | 4.2% | 4.6% |
| Standard Deviation (Population) | 4.2% | 4.5% |
Similar Demographics by Family Poverty
Demographics Similar to Immigrants from Nigeria by Family Poverty
In terms of family poverty, the demographic groups most similar to Immigrants from Nigeria are Nigerian (10.1%, a difference of 0.25%), Immigrants from Laos (10.2%, a difference of 0.26%), Immigrants from Middle Africa (10.1%, a difference of 0.28%), Fijian (10.1%, a difference of 0.39%), and French American Indian (10.2%, a difference of 0.63%).
| Demographics | Rating | Rank | Family Poverty |
| Immigrants | Uzbekistan | 3.1 /100 | #229 | Tragic 10.0% |
| Immigrants | Panama | 3.1 /100 | #230 | Tragic 10.0% |
| Alaskan Athabascans | 2.7 /100 | #231 | Tragic 10.1% |
| Immigrants | Sudan | 2.3 /100 | #232 | Tragic 10.1% |
| Fijians | 2.1 /100 | #233 | Tragic 10.1% |
| Immigrants | Middle Africa | 2.1 /100 | #234 | Tragic 10.1% |
| Nigerians | 2.0 /100 | #235 | Tragic 10.1% |
| Immigrants | Nigeria | 1.9 /100 | #236 | Tragic 10.2% |
| Immigrants | Laos | 1.7 /100 | #237 | Tragic 10.2% |
| French American Indians | 1.5 /100 | #238 | Tragic 10.2% |
| Potawatomi | 1.5 /100 | #239 | Tragic 10.2% |
| Immigrants | Azores | 1.4 /100 | #240 | Tragic 10.3% |
| Ghanaians | 1.3 /100 | #241 | Tragic 10.3% |
| Alaska Natives | 1.0 /100 | #242 | Tragic 10.4% |
| Nepalese | 0.8 /100 | #243 | Tragic 10.4% |
Demographics Similar to Immigrants from Bahamas by Family Poverty
In terms of family poverty, the demographic groups most similar to Immigrants from Bahamas are Immigrants from Jamaica (11.2%, a difference of 0.10%), Immigrants from Ecuador (11.1%, a difference of 0.25%), Immigrants from Nicaragua (11.1%, a difference of 0.25%), Somali (11.2%, a difference of 0.61%), and Spanish American (11.2%, a difference of 0.70%).
| Demographics | Rating | Rank | Family Poverty |
| Trinidadians and Tobagonians | 0.1 /100 | #264 | Tragic 10.9% |
| Immigrants | Trinidad and Tobago | 0.1 /100 | #265 | Tragic 10.9% |
| Immigrants | El Salvador | 0.1 /100 | #266 | Tragic 11.0% |
| Comanche | 0.1 /100 | #267 | Tragic 11.0% |
| Jamaicans | 0.1 /100 | #268 | Tragic 11.1% |
| Immigrants | Ecuador | 0.1 /100 | #269 | Tragic 11.1% |
| Immigrants | Nicaragua | 0.1 /100 | #270 | Tragic 11.1% |
| Immigrants | Bahamas | 0.1 /100 | #271 | Tragic 11.1% |
| Immigrants | Jamaica | 0.1 /100 | #272 | Tragic 11.2% |
| Somalis | 0.1 /100 | #273 | Tragic 11.2% |
| Spanish Americans | 0.1 /100 | #274 | Tragic 11.2% |
| Central Americans | 0.1 /100 | #275 | Tragic 11.2% |
| Immigrants | Guyana | 0.1 /100 | #276 | Tragic 11.2% |
| Chippewa | 0.1 /100 | #277 | Tragic 11.2% |
| Guyanese | 0.1 /100 | #278 | Tragic 11.2% |