Spanish American Indian vs Immigrants from Bahamas Family Poverty
COMPARE
Spanish American Indian
Immigrants from Bahamas
Family Poverty
Family Poverty Comparison
Spanish American Indians
Immigrants from Bahamas
10.9%
FAMILY POVERTY
0.2/ 100
METRIC RATING
262nd/ 347
METRIC RANK
11.1%
FAMILY POVERTY
0.1/ 100
METRIC RATING
271st/ 347
METRIC RANK
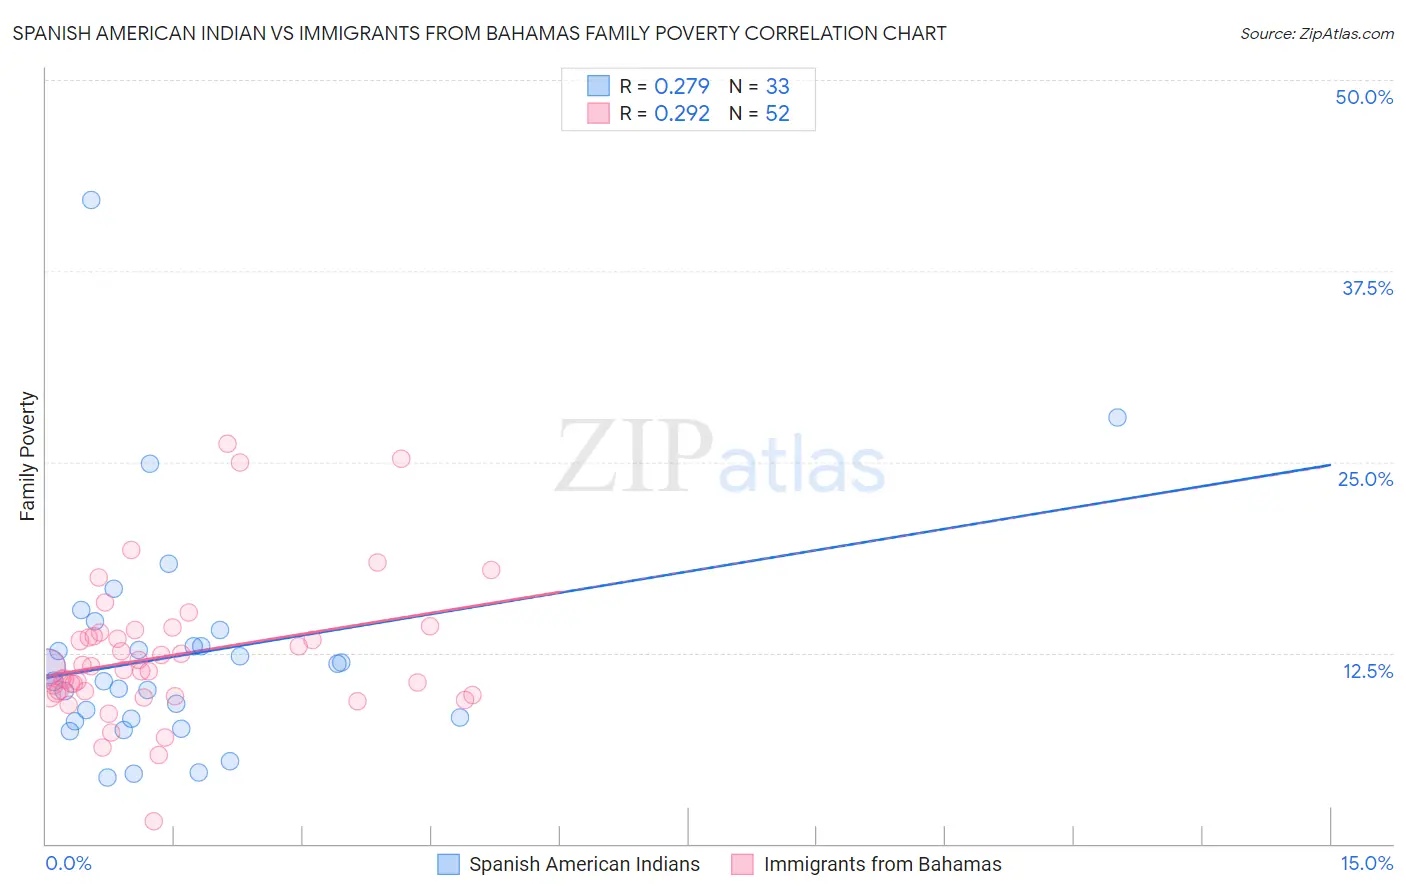
Spanish American Indian vs Immigrants from Bahamas Family Poverty Correlation Chart
The statistical analysis conducted on geographies consisting of 73,121,787 people shows a weak positive correlation between the proportion of Spanish American Indians and poverty level among families in the United States with a correlation coefficient (R) of 0.279 and weighted average of 10.9%. Similarly, the statistical analysis conducted on geographies consisting of 104,583,559 people shows a weak positive correlation between the proportion of Immigrants from Bahamas and poverty level among families in the United States with a correlation coefficient (R) of 0.292 and weighted average of 11.1%, a difference of 2.1%.
Family Poverty Correlation Summary
| Measurement | Spanish American Indian | Immigrants from Bahamas |
| Minimum | 4.4% | 1.5% |
| Maximum | 42.1% | 26.2% |
| Range | 37.8% | 24.7% |
| Mean | 12.4% | 12.3% |
| Median | 10.7% | 11.4% |
| Interquartile 25% (IQ1) | 8.1% | 9.8% |
| Interquartile 75% (IQ3) | 13.5% | 13.7% |
| Interquartile Range (IQR) | 5.4% | 3.9% |
| Standard Deviation (Sample) | 7.4% | 4.6% |
| Standard Deviation (Population) | 7.3% | 4.5% |
Demographics Similar to Spanish American Indians and Immigrants from Bahamas by Family Poverty
In terms of family poverty, the demographic groups most similar to Spanish American Indians are Shoshone (10.9%, a difference of 0.13%), Bangladeshi (10.9%, a difference of 0.17%), Cape Verdean (10.9%, a difference of 0.26%), Trinidadian and Tobagonian (10.9%, a difference of 0.28%), and Immigrants from Trinidad and Tobago (10.9%, a difference of 0.33%). Similarly, the demographic groups most similar to Immigrants from Bahamas are Immigrants from Jamaica (11.2%, a difference of 0.10%), Immigrants from Ecuador (11.1%, a difference of 0.25%), Immigrants from Nicaragua (11.1%, a difference of 0.25%), Somali (11.2%, a difference of 0.61%), and Spanish American (11.2%, a difference of 0.70%).
| Demographics | Rating | Rank | Family Poverty |
| Chickasaw | 0.2 /100 | #256 | Tragic 10.8% |
| Immigrants | Ghana | 0.2 /100 | #257 | Tragic 10.8% |
| Sub-Saharan Africans | 0.2 /100 | #258 | Tragic 10.9% |
| Mexican American Indians | 0.2 /100 | #259 | Tragic 10.9% |
| Bangladeshis | 0.2 /100 | #260 | Tragic 10.9% |
| Shoshone | 0.2 /100 | #261 | Tragic 10.9% |
| Spanish American Indians | 0.2 /100 | #262 | Tragic 10.9% |
| Cape Verdeans | 0.1 /100 | #263 | Tragic 10.9% |
| Trinidadians and Tobagonians | 0.1 /100 | #264 | Tragic 10.9% |
| Immigrants | Trinidad and Tobago | 0.1 /100 | #265 | Tragic 10.9% |
| Immigrants | El Salvador | 0.1 /100 | #266 | Tragic 11.0% |
| Comanche | 0.1 /100 | #267 | Tragic 11.0% |
| Jamaicans | 0.1 /100 | #268 | Tragic 11.1% |
| Immigrants | Ecuador | 0.1 /100 | #269 | Tragic 11.1% |
| Immigrants | Nicaragua | 0.1 /100 | #270 | Tragic 11.1% |
| Immigrants | Bahamas | 0.1 /100 | #271 | Tragic 11.1% |
| Immigrants | Jamaica | 0.1 /100 | #272 | Tragic 11.2% |
| Somalis | 0.1 /100 | #273 | Tragic 11.2% |
| Spanish Americans | 0.1 /100 | #274 | Tragic 11.2% |
| Central Americans | 0.1 /100 | #275 | Tragic 11.2% |
| Immigrants | Guyana | 0.1 /100 | #276 | Tragic 11.2% |