Iroquois vs Immigrants from Albania Unemployment Among Seniors over 75 years
COMPARE
Iroquois
Immigrants from Albania
Unemployment Among Seniors over 75 years
Unemployment Among Seniors over 75 years Comparison
Iroquois
Immigrants from Albania
9.3%
UNEMPLOYMENT AMONG SENIORS OVER 75 YEARS
0.7/ 100
METRIC RATING
264th/ 347
METRIC RANK
7.9%
UNEMPLOYMENT AMONG SENIORS OVER 75 YEARS
99.9/ 100
METRIC RATING
62nd/ 347
METRIC RANK
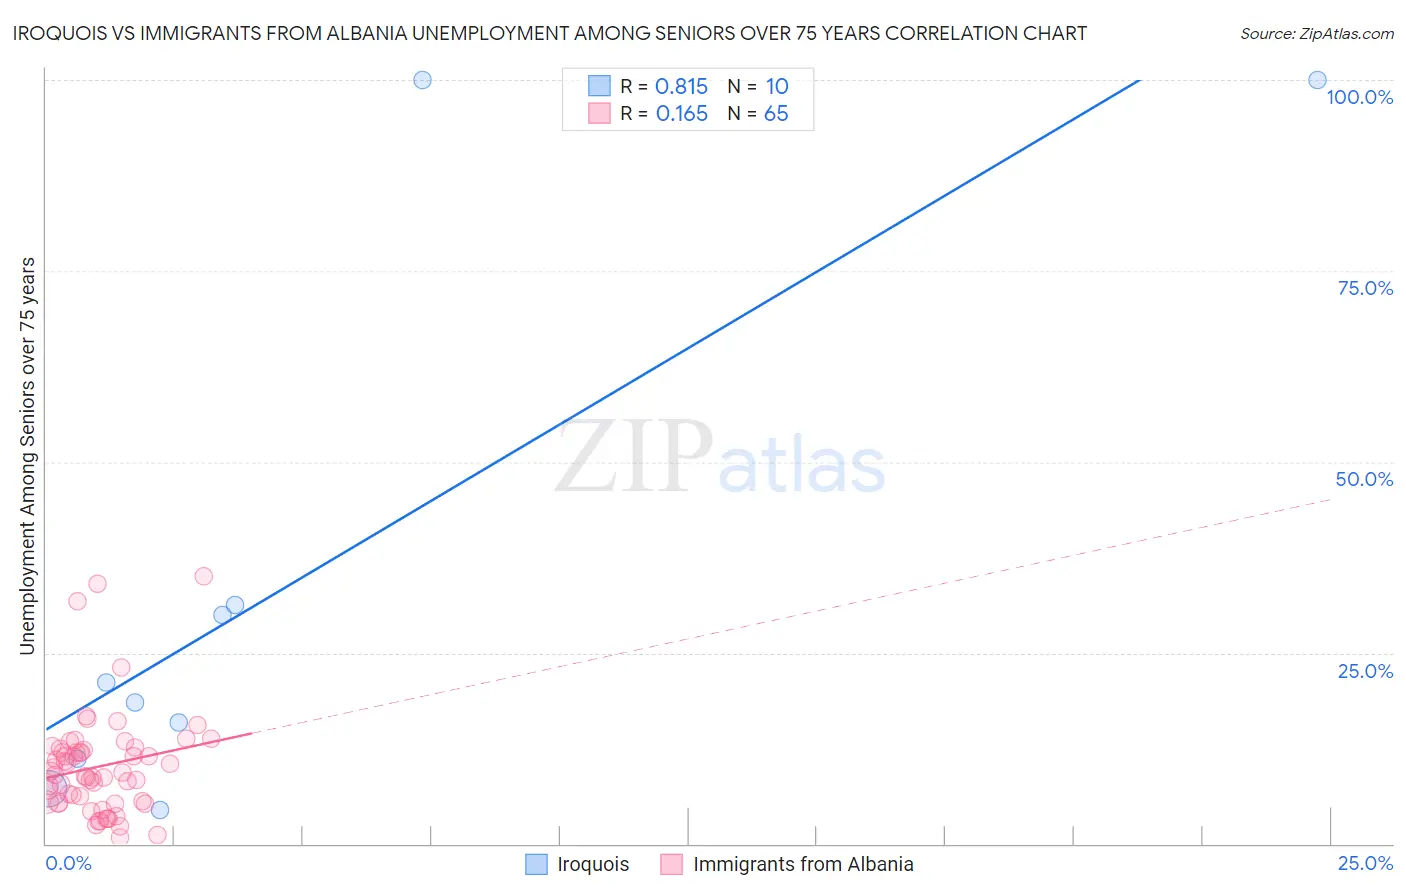
Iroquois vs Immigrants from Albania Unemployment Among Seniors over 75 years Correlation Chart
The statistical analysis conducted on geographies consisting of 125,150,870 people shows a very strong positive correlation between the proportion of Iroquois and unemployment rate among seniors over the age of 75 in the United States with a correlation coefficient (R) of 0.815 and weighted average of 9.3%. Similarly, the statistical analysis conducted on geographies consisting of 83,788,763 people shows a poor positive correlation between the proportion of Immigrants from Albania and unemployment rate among seniors over the age of 75 in the United States with a correlation coefficient (R) of 0.165 and weighted average of 7.9%, a difference of 17.8%.
Unemployment Among Seniors over 75 years Correlation Summary
| Measurement | Iroquois | Immigrants from Albania |
| Minimum | 4.3% | 0.80% |
| Maximum | 100.0% | 35.0% |
| Range | 95.7% | 34.2% |
| Mean | 34.0% | 10.1% |
| Median | 19.8% | 9.0% |
| Interquartile 25% (IQ1) | 11.2% | 5.4% |
| Interquartile 75% (IQ3) | 31.3% | 12.3% |
| Interquartile Range (IQR) | 20.1% | 6.9% |
| Standard Deviation (Sample) | 35.9% | 6.8% |
| Standard Deviation (Population) | 34.0% | 6.7% |
Similar Demographics by Unemployment Among Seniors over 75 years
Demographics Similar to Iroquois by Unemployment Among Seniors over 75 years
In terms of unemployment among seniors over 75 years, the demographic groups most similar to Iroquois are Ukrainian (9.3%, a difference of 0.010%), Palestinian (9.3%, a difference of 0.12%), Austrian (9.3%, a difference of 0.13%), Celtic (9.3%, a difference of 0.23%), and Black/African American (9.4%, a difference of 0.45%).
| Demographics | Rating | Rank | Unemployment Among Seniors over 75 years |
| Hawaiians | 1.2 /100 | #257 | Tragic 9.3% |
| Immigrants | England | 1.0 /100 | #258 | Tragic 9.3% |
| Slovenes | 1.0 /100 | #259 | Tragic 9.3% |
| Immigrants | Cameroon | 1.0 /100 | #260 | Tragic 9.3% |
| Celtics | 0.8 /100 | #261 | Tragic 9.3% |
| Austrians | 0.7 /100 | #262 | Tragic 9.3% |
| Ukrainians | 0.7 /100 | #263 | Tragic 9.3% |
| Iroquois | 0.7 /100 | #264 | Tragic 9.3% |
| Palestinians | 0.6 /100 | #265 | Tragic 9.3% |
| Blacks/African Americans | 0.5 /100 | #266 | Tragic 9.4% |
| Immigrants | Mexico | 0.4 /100 | #267 | Tragic 9.4% |
| Greeks | 0.4 /100 | #268 | Tragic 9.4% |
| Puerto Ricans | 0.3 /100 | #269 | Tragic 9.4% |
| Yaqui | 0.3 /100 | #270 | Tragic 9.4% |
| Bulgarians | 0.3 /100 | #271 | Tragic 9.4% |
Demographics Similar to Immigrants from Albania by Unemployment Among Seniors over 75 years
In terms of unemployment among seniors over 75 years, the demographic groups most similar to Immigrants from Albania are Uruguayan (7.9%, a difference of 0.030%), Immigrants from Morocco (7.9%, a difference of 0.060%), Immigrants from Nicaragua (7.9%, a difference of 0.070%), Indonesian (7.9%, a difference of 0.11%), and Immigrants from Taiwan (7.9%, a difference of 0.13%).
| Demographics | Rating | Rank | Unemployment Among Seniors over 75 years |
| Filipinos | 99.9 /100 | #55 | Exceptional 7.9% |
| Immigrants | Eastern Asia | 99.9 /100 | #56 | Exceptional 7.9% |
| Ottawa | 99.9 /100 | #57 | Exceptional 7.9% |
| Iranians | 99.9 /100 | #58 | Exceptional 7.9% |
| Indonesians | 99.9 /100 | #59 | Exceptional 7.9% |
| Immigrants | Morocco | 99.9 /100 | #60 | Exceptional 7.9% |
| Uruguayans | 99.9 /100 | #61 | Exceptional 7.9% |
| Immigrants | Albania | 99.9 /100 | #62 | Exceptional 7.9% |
| Immigrants | Nicaragua | 99.9 /100 | #63 | Exceptional 7.9% |
| Immigrants | Taiwan | 99.9 /100 | #64 | Exceptional 7.9% |
| Argentineans | 99.9 /100 | #65 | Exceptional 7.9% |
| Immigrants | Austria | 99.9 /100 | #66 | Exceptional 8.0% |
| Immigrants | Syria | 99.9 /100 | #67 | Exceptional 8.0% |
| Immigrants | South Africa | 99.9 /100 | #68 | Exceptional 8.0% |
| Indians (Asian) | 99.9 /100 | #69 | Exceptional 8.0% |