Immigrants from Western Asia vs Immigrants from Albania Family Poverty
COMPARE
Immigrants from Western Asia
Immigrants from Albania
Family Poverty
Family Poverty Comparison
Immigrants from Western Asia
Immigrants from Albania
9.3%
FAMILY POVERTY
28.2/ 100
METRIC RATING
193rd/ 347
METRIC RANK
9.0%
FAMILY POVERTY
50.0/ 100
METRIC RATING
174th/ 347
METRIC RANK
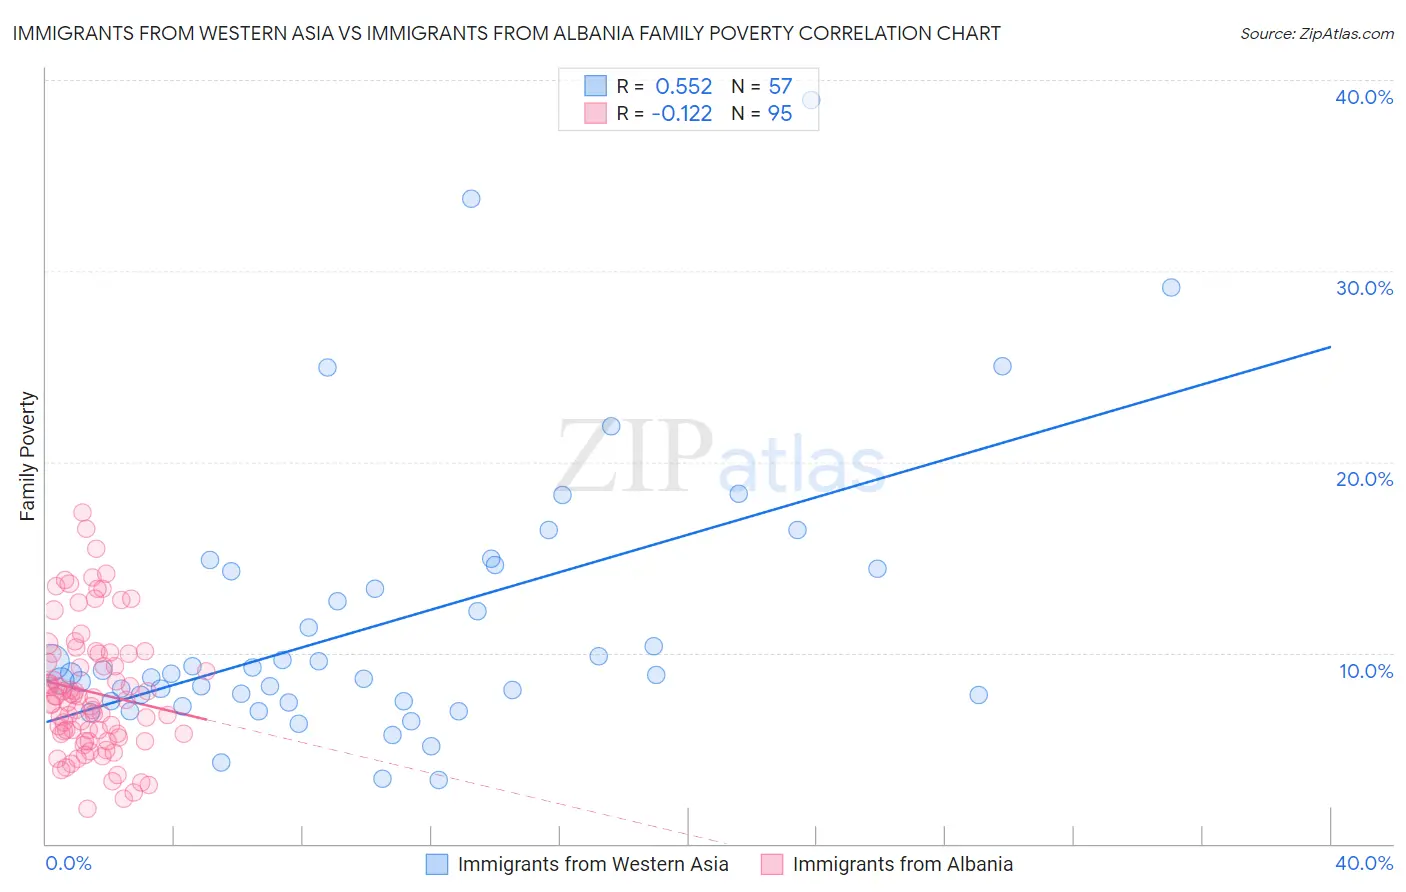
Immigrants from Western Asia vs Immigrants from Albania Family Poverty Correlation Chart
The statistical analysis conducted on geographies consisting of 403,212,379 people shows a substantial positive correlation between the proportion of Immigrants from Western Asia and poverty level among families in the United States with a correlation coefficient (R) of 0.552 and weighted average of 9.3%. Similarly, the statistical analysis conducted on geographies consisting of 119,258,186 people shows a poor negative correlation between the proportion of Immigrants from Albania and poverty level among families in the United States with a correlation coefficient (R) of -0.122 and weighted average of 9.0%, a difference of 3.1%.
Family Poverty Correlation Summary
| Measurement | Immigrants from Western Asia | Immigrants from Albania |
| Minimum | 3.3% | 1.8% |
| Maximum | 38.9% | 17.3% |
| Range | 35.6% | 15.5% |
| Mean | 11.6% | 7.9% |
| Median | 8.9% | 7.5% |
| Interquartile 25% (IQ1) | 7.5% | 5.7% |
| Interquartile 75% (IQ3) | 14.3% | 10.0% |
| Interquartile Range (IQR) | 6.9% | 4.2% |
| Standard Deviation (Sample) | 7.2% | 3.3% |
| Standard Deviation (Population) | 7.1% | 3.3% |
Demographics Similar to Immigrants from Western Asia and Immigrants from Albania by Family Poverty
In terms of family poverty, the demographic groups most similar to Immigrants from Western Asia are Spanish (9.3%, a difference of 0.070%), Ugandan (9.3%, a difference of 0.080%), Arab (9.2%, a difference of 0.50%), Immigrants from Afghanistan (9.2%, a difference of 0.59%), and Immigrants from Kenya (9.2%, a difference of 0.87%). Similarly, the demographic groups most similar to Immigrants from Albania are Costa Rican (9.0%, a difference of 0.090%), Immigrants from Syria (9.0%, a difference of 0.33%), Hawaiian (9.0%, a difference of 0.36%), Immigrants from Cameroon (9.0%, a difference of 0.37%), and Immigrants from Iraq (9.1%, a difference of 0.74%).
| Demographics | Rating | Rank | Family Poverty |
| Immigrants | Fiji | 56.4 /100 | #173 | Average 8.9% |
| Immigrants | Albania | 50.0 /100 | #174 | Average 9.0% |
| Costa Ricans | 49.3 /100 | #175 | Average 9.0% |
| Immigrants | Syria | 47.5 /100 | #176 | Average 9.0% |
| Hawaiians | 47.2 /100 | #177 | Average 9.0% |
| Immigrants | Cameroon | 47.1 /100 | #178 | Average 9.0% |
| Immigrants | Iraq | 44.4 /100 | #179 | Average 9.1% |
| Immigrants | Uganda | 43.4 /100 | #180 | Average 9.1% |
| Hmong | 40.2 /100 | #181 | Average 9.1% |
| Immigrants | Morocco | 40.2 /100 | #182 | Average 9.1% |
| Uruguayans | 39.2 /100 | #183 | Fair 9.1% |
| South American Indians | 38.7 /100 | #184 | Fair 9.1% |
| Immigrants | Saudi Arabia | 38.6 /100 | #185 | Fair 9.1% |
| Colombians | 36.1 /100 | #186 | Fair 9.2% |
| Delaware | 35.4 /100 | #187 | Fair 9.2% |
| Immigrants | Kenya | 34.0 /100 | #188 | Fair 9.2% |
| Immigrants | Afghanistan | 32.1 /100 | #189 | Fair 9.2% |
| Arabs | 31.5 /100 | #190 | Fair 9.2% |
| Ugandans | 28.7 /100 | #191 | Fair 9.3% |
| Spanish | 28.7 /100 | #192 | Fair 9.3% |
| Immigrants | Western Asia | 28.2 /100 | #193 | Fair 9.3% |