Immigrants from Fiji vs Finnish Family Poverty
COMPARE
Immigrants from Fiji
Finnish
Family Poverty
Family Poverty Comparison
Immigrants from Fiji
Finns
8.9%
FAMILY POVERTY
56.4/ 100
METRIC RATING
173rd/ 347
METRIC RANK
7.7%
FAMILY POVERTY
98.7/ 100
METRIC RATING
58th/ 347
METRIC RANK
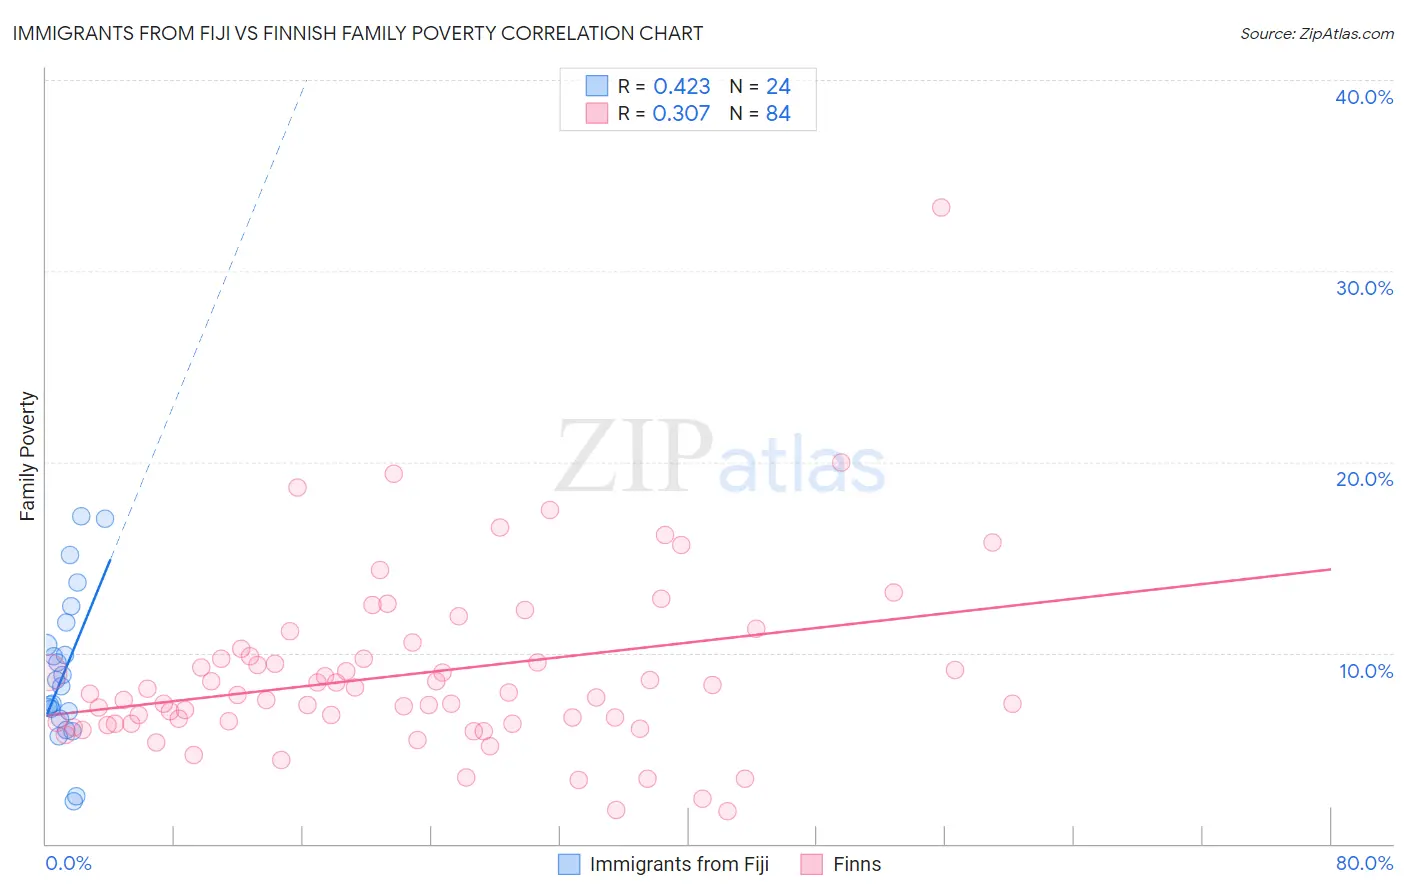
Immigrants from Fiji vs Finnish Family Poverty Correlation Chart
The statistical analysis conducted on geographies consisting of 93,742,503 people shows a moderate positive correlation between the proportion of Immigrants from Fiji and poverty level among families in the United States with a correlation coefficient (R) of 0.423 and weighted average of 8.9%. Similarly, the statistical analysis conducted on geographies consisting of 403,232,435 people shows a mild positive correlation between the proportion of Finns and poverty level among families in the United States with a correlation coefficient (R) of 0.307 and weighted average of 7.7%, a difference of 15.5%.
Family Poverty Correlation Summary
| Measurement | Immigrants from Fiji | Finnish |
| Minimum | 2.3% | 1.7% |
| Maximum | 17.2% | 33.3% |
| Range | 14.9% | 31.6% |
| Mean | 9.0% | 8.9% |
| Median | 8.4% | 7.8% |
| Interquartile 25% (IQ1) | 6.7% | 6.3% |
| Interquartile 75% (IQ3) | 11.0% | 9.8% |
| Interquartile Range (IQR) | 4.3% | 3.5% |
| Standard Deviation (Sample) | 3.9% | 4.7% |
| Standard Deviation (Population) | 3.8% | 4.7% |
Similar Demographics by Family Poverty
Demographics Similar to Immigrants from Fiji by Family Poverty
In terms of family poverty, the demographic groups most similar to Immigrants from Fiji are Immigrants from Peru (8.9%, a difference of 0.15%), Lebanese (8.9%, a difference of 0.16%), Kenyan (8.9%, a difference of 0.25%), Immigrants from Chile (8.9%, a difference of 0.44%), and Israeli (8.9%, a difference of 0.79%).
| Demographics | Rating | Rank | Family Poverty |
| Afghans | 63.5 /100 | #166 | Good 8.8% |
| Immigrants | Ethiopia | 62.5 /100 | #167 | Good 8.9% |
| Israelis | 62.1 /100 | #168 | Good 8.9% |
| Immigrants | Chile | 59.6 /100 | #169 | Average 8.9% |
| Kenyans | 58.2 /100 | #170 | Average 8.9% |
| Lebanese | 57.6 /100 | #171 | Average 8.9% |
| Immigrants | Peru | 57.5 /100 | #172 | Average 8.9% |
| Immigrants | Fiji | 56.4 /100 | #173 | Average 8.9% |
| Immigrants | Albania | 50.0 /100 | #174 | Average 9.0% |
| Costa Ricans | 49.3 /100 | #175 | Average 9.0% |
| Immigrants | Syria | 47.5 /100 | #176 | Average 9.0% |
| Hawaiians | 47.2 /100 | #177 | Average 9.0% |
| Immigrants | Cameroon | 47.1 /100 | #178 | Average 9.0% |
| Immigrants | Iraq | 44.4 /100 | #179 | Average 9.1% |
| Immigrants | Uganda | 43.4 /100 | #180 | Average 9.1% |
Demographics Similar to Finns by Family Poverty
In terms of family poverty, the demographic groups most similar to Finns are European (7.7%, a difference of 0.010%), Immigrants from Greece (7.7%, a difference of 0.020%), Asian (7.7%, a difference of 0.030%), Immigrants from Serbia (7.7%, a difference of 0.12%), and Immigrants from Eastern Asia (7.7%, a difference of 0.16%).
| Demographics | Rating | Rank | Family Poverty |
| Immigrants | Moldova | 98.8 /100 | #51 | Exceptional 7.7% |
| Indians (Asian) | 98.8 /100 | #52 | Exceptional 7.7% |
| Swiss | 98.8 /100 | #53 | Exceptional 7.7% |
| Immigrants | Sweden | 98.8 /100 | #54 | Exceptional 7.7% |
| Immigrants | Eastern Asia | 98.7 /100 | #55 | Exceptional 7.7% |
| Immigrants | Serbia | 98.7 /100 | #56 | Exceptional 7.7% |
| Asians | 98.7 /100 | #57 | Exceptional 7.7% |
| Finns | 98.7 /100 | #58 | Exceptional 7.7% |
| Europeans | 98.7 /100 | #59 | Exceptional 7.7% |
| Immigrants | Greece | 98.7 /100 | #60 | Exceptional 7.7% |
| Immigrants | Netherlands | 98.6 /100 | #61 | Exceptional 7.7% |
| Macedonians | 98.6 /100 | #62 | Exceptional 7.8% |
| Zimbabweans | 98.4 /100 | #63 | Exceptional 7.8% |
| Koreans | 98.3 /100 | #64 | Exceptional 7.8% |
| Immigrants | Bulgaria | 98.3 /100 | #65 | Exceptional 7.8% |