Hispanic or Latino vs Macedonian Single Female Poverty
COMPARE
Hispanic or Latino
Macedonian
Single Female Poverty
Single Female Poverty Comparison
Hispanics or Latinos
Macedonians
24.6%
SINGLE FEMALE POVERTY
0.0/ 100
METRIC RATING
295th/ 347
METRIC RANK
18.9%
SINGLE FEMALE POVERTY
99.8/ 100
METRIC RATING
46th/ 347
METRIC RANK
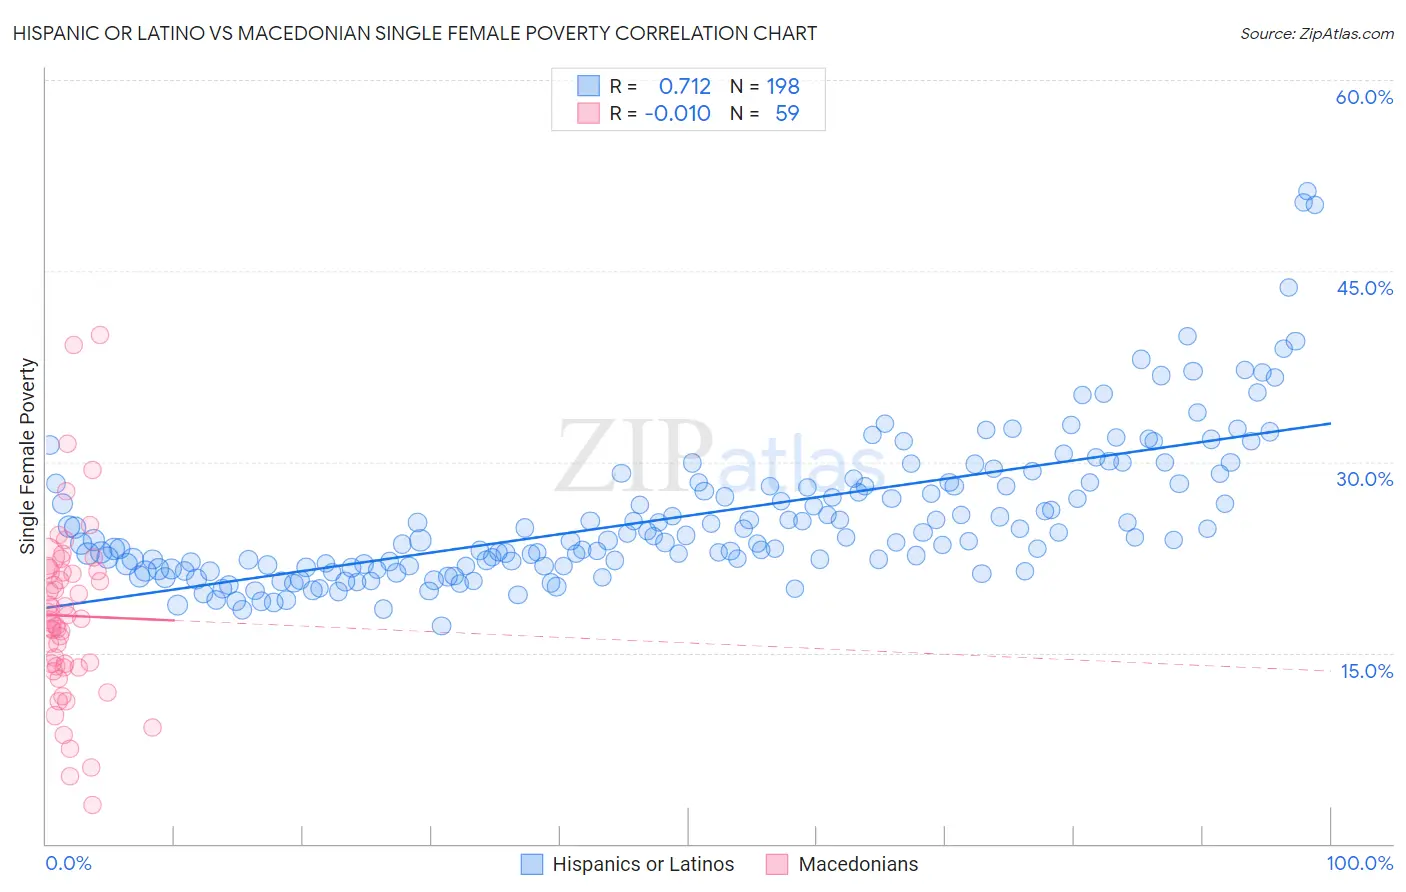
Hispanic or Latino vs Macedonian Single Female Poverty Correlation Chart
The statistical analysis conducted on geographies consisting of 554,629,261 people shows a strong positive correlation between the proportion of Hispanics or Latinos and poverty level among single females in the United States with a correlation coefficient (R) of 0.712 and weighted average of 24.6%. Similarly, the statistical analysis conducted on geographies consisting of 131,464,116 people shows no correlation between the proportion of Macedonians and poverty level among single females in the United States with a correlation coefficient (R) of -0.010 and weighted average of 18.9%, a difference of 30.0%.
Single Female Poverty Correlation Summary
| Measurement | Hispanic or Latino | Macedonian |
| Minimum | 17.1% | 3.0% |
| Maximum | 51.2% | 40.0% |
| Range | 34.2% | 37.0% |
| Mean | 25.7% | 17.9% |
| Median | 23.9% | 17.6% |
| Interquartile 25% (IQ1) | 21.8% | 13.9% |
| Interquartile 75% (IQ3) | 28.3% | 21.4% |
| Interquartile Range (IQR) | 6.5% | 7.5% |
| Standard Deviation (Sample) | 5.8% | 7.0% |
| Standard Deviation (Population) | 5.8% | 6.9% |
Similar Demographics by Single Female Poverty
Demographics Similar to Hispanics or Latinos by Single Female Poverty
In terms of single female poverty, the demographic groups most similar to Hispanics or Latinos are French American Indian (24.6%, a difference of 0.35%), African (24.8%, a difference of 0.48%), American (24.5%, a difference of 0.49%), Alsatian (24.5%, a difference of 0.57%), and Immigrants from Central America (24.8%, a difference of 0.76%).
| Demographics | Rating | Rank | Single Female Poverty |
| Spanish Americans | 0.0 /100 | #288 | Tragic 24.2% |
| U.S. Virgin Islanders | 0.0 /100 | #289 | Tragic 24.2% |
| Indonesians | 0.0 /100 | #290 | Tragic 24.3% |
| Osage | 0.0 /100 | #291 | Tragic 24.4% |
| Alsatians | 0.0 /100 | #292 | Tragic 24.5% |
| Americans | 0.0 /100 | #293 | Tragic 24.5% |
| French American Indians | 0.0 /100 | #294 | Tragic 24.6% |
| Hispanics or Latinos | 0.0 /100 | #295 | Tragic 24.6% |
| Africans | 0.0 /100 | #296 | Tragic 24.8% |
| Immigrants | Central America | 0.0 /100 | #297 | Tragic 24.8% |
| Yaqui | 0.0 /100 | #298 | Tragic 24.9% |
| Mexicans | 0.0 /100 | #299 | Tragic 25.0% |
| Blackfeet | 0.0 /100 | #300 | Tragic 25.1% |
| Hondurans | 0.0 /100 | #301 | Tragic 25.1% |
| Shoshone | 0.0 /100 | #302 | Tragic 25.1% |
Demographics Similar to Macedonians by Single Female Poverty
In terms of single female poverty, the demographic groups most similar to Macedonians are Immigrants from Indonesia (18.9%, a difference of 0.16%), Latvian (19.0%, a difference of 0.19%), Immigrants from Croatia (18.9%, a difference of 0.38%), Immigrants from Argentina (19.0%, a difference of 0.46%), and Immigrants from Czechoslovakia (19.0%, a difference of 0.47%).
| Demographics | Rating | Rank | Single Female Poverty |
| Bulgarians | 99.9 /100 | #39 | Exceptional 18.8% |
| Okinawans | 99.9 /100 | #40 | Exceptional 18.8% |
| Immigrants | Serbia | 99.9 /100 | #41 | Exceptional 18.8% |
| Jordanians | 99.9 /100 | #42 | Exceptional 18.8% |
| Immigrants | Romania | 99.9 /100 | #43 | Exceptional 18.8% |
| Immigrants | Croatia | 99.9 /100 | #44 | Exceptional 18.9% |
| Immigrants | Indonesia | 99.8 /100 | #45 | Exceptional 18.9% |
| Macedonians | 99.8 /100 | #46 | Exceptional 18.9% |
| Latvians | 99.8 /100 | #47 | Exceptional 19.0% |
| Immigrants | Argentina | 99.8 /100 | #48 | Exceptional 19.0% |
| Immigrants | Czechoslovakia | 99.8 /100 | #49 | Exceptional 19.0% |
| Immigrants | Eastern Europe | 99.8 /100 | #50 | Exceptional 19.0% |
| Immigrants | Italy | 99.8 /100 | #51 | Exceptional 19.0% |
| Egyptians | 99.7 /100 | #52 | Exceptional 19.1% |
| Tsimshian | 99.7 /100 | #53 | Exceptional 19.1% |