Immigrants from Haiti vs Immigrants from Nigeria Single Female Poverty
COMPARE
Immigrants from Haiti
Immigrants from Nigeria
Single Female Poverty
Single Female Poverty Comparison
Immigrants from Haiti
Immigrants from Nigeria
21.5%
SINGLE FEMALE POVERTY
18.8/ 100
METRIC RATING
203rd/ 347
METRIC RANK
21.2%
SINGLE FEMALE POVERTY
36.8/ 100
METRIC RATING
187th/ 347
METRIC RANK
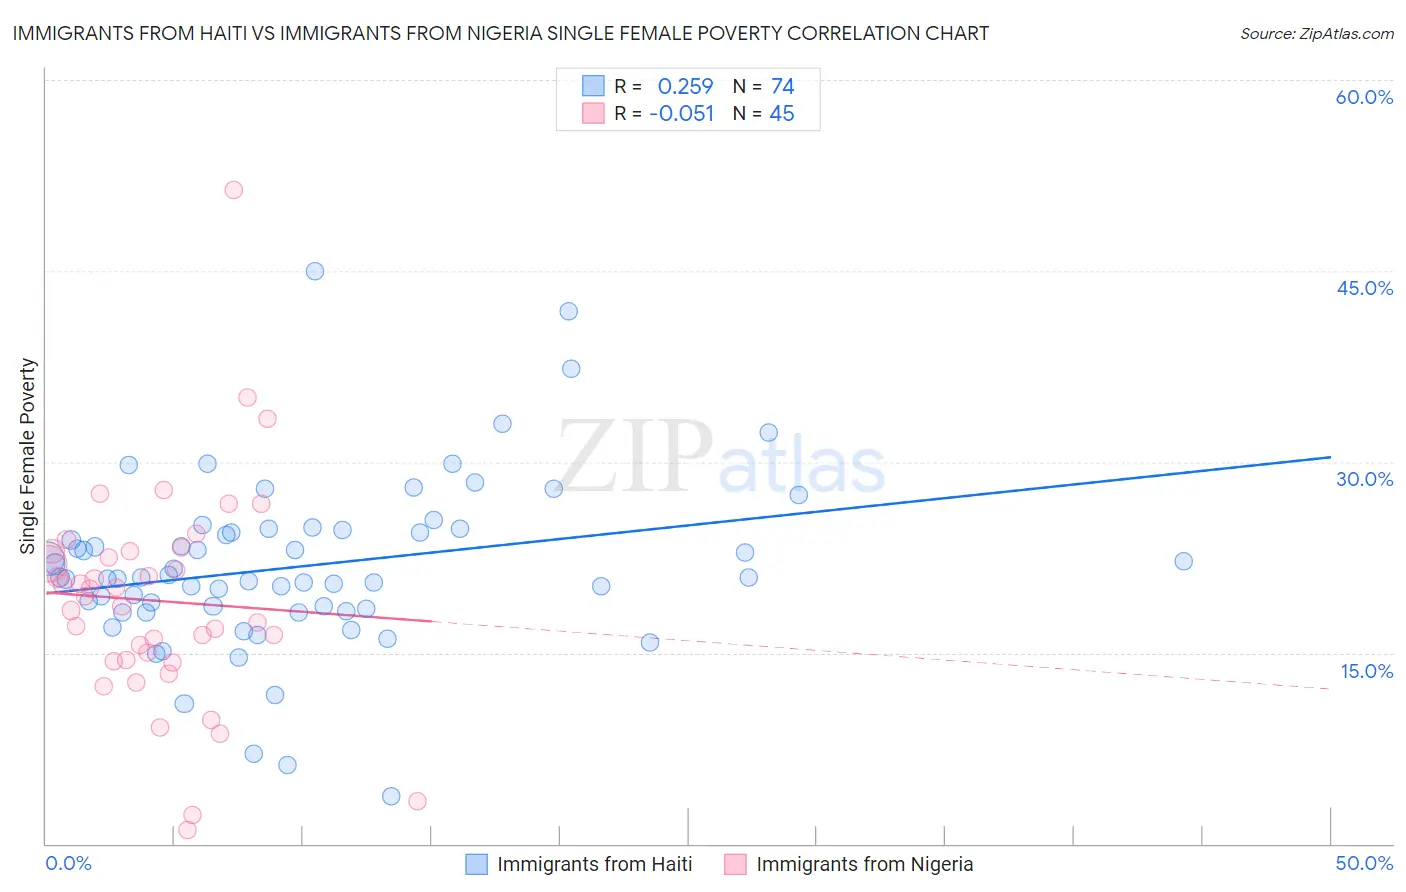
Immigrants from Haiti vs Immigrants from Nigeria Single Female Poverty Correlation Chart
The statistical analysis conducted on geographies consisting of 223,147,681 people shows a weak positive correlation between the proportion of Immigrants from Haiti and poverty level among single females in the United States with a correlation coefficient (R) of 0.259 and weighted average of 21.5%. Similarly, the statistical analysis conducted on geographies consisting of 281,424,255 people shows a slight negative correlation between the proportion of Immigrants from Nigeria and poverty level among single females in the United States with a correlation coefficient (R) of -0.051 and weighted average of 21.2%, a difference of 1.4%.
Single Female Poverty Correlation Summary
| Measurement | Immigrants from Haiti | Immigrants from Nigeria |
| Minimum | 3.7% | 1.1% |
| Maximum | 45.0% | 51.4% |
| Range | 41.2% | 50.2% |
| Mean | 21.8% | 19.1% |
| Median | 20.9% | 19.4% |
| Interquartile 25% (IQ1) | 18.5% | 14.4% |
| Interquartile 75% (IQ3) | 24.7% | 23.0% |
| Interquartile Range (IQR) | 6.2% | 8.6% |
| Standard Deviation (Sample) | 6.8% | 8.7% |
| Standard Deviation (Population) | 6.7% | 8.6% |
Demographics Similar to Immigrants from Haiti and Immigrants from Nigeria by Single Female Poverty
In terms of single female poverty, the demographic groups most similar to Immigrants from Haiti are Immigrants from Kenya (21.4%, a difference of 0.18%), Nigerian (21.4%, a difference of 0.20%), Immigrants from Africa (21.5%, a difference of 0.21%), Irish (21.4%, a difference of 0.25%), and Finnish (21.5%, a difference of 0.27%). Similarly, the demographic groups most similar to Immigrants from Nigeria are Hawaiian (21.2%, a difference of 0.060%), Yugoslavian (21.2%, a difference of 0.090%), Immigrants from Cambodia (21.2%, a difference of 0.10%), Immigrants from Cuba (21.2%, a difference of 0.10%), and Trinidadian and Tobagonian (21.2%, a difference of 0.10%).
| Demographics | Rating | Rank | Single Female Poverty |
| Immigrants | Cambodia | 38.2 /100 | #185 | Fair 21.2% |
| Hawaiians | 37.7 /100 | #186 | Fair 21.2% |
| Immigrants | Nigeria | 36.8 /100 | #187 | Fair 21.2% |
| Yugoslavians | 35.4 /100 | #188 | Fair 21.2% |
| Immigrants | Cuba | 35.3 /100 | #189 | Fair 21.2% |
| Trinidadians and Tobagonians | 35.2 /100 | #190 | Fair 21.2% |
| Immigrants | Germany | 31.1 /100 | #191 | Fair 21.3% |
| Immigrants | Jamaica | 30.5 /100 | #192 | Fair 21.3% |
| Basques | 28.1 /100 | #193 | Fair 21.3% |
| Czechoslovakians | 27.7 /100 | #194 | Fair 21.3% |
| Nicaraguans | 27.6 /100 | #195 | Fair 21.3% |
| Immigrants | Saudi Arabia | 27.1 /100 | #196 | Fair 21.3% |
| Japanese | 26.4 /100 | #197 | Fair 21.3% |
| Swiss | 24.2 /100 | #198 | Fair 21.4% |
| Immigrants | Immigrants | 22.0 /100 | #199 | Fair 21.4% |
| Irish | 21.4 /100 | #200 | Fair 21.4% |
| Nigerians | 20.9 /100 | #201 | Fair 21.4% |
| Immigrants | Kenya | 20.7 /100 | #202 | Fair 21.4% |
| Immigrants | Haiti | 18.8 /100 | #203 | Poor 21.5% |
| Immigrants | Africa | 16.7 /100 | #204 | Poor 21.5% |
| Finns | 16.2 /100 | #205 | Poor 21.5% |