Iranian vs Shoshone Receiving Food Stamps
COMPARE
Iranian
Shoshone
Receiving Food Stamps
Receiving Food Stamps Comparison
Iranians
Shoshone
7.9%
RECEIVING FOOD STAMPS
100.0/ 100
METRIC RATING
4th/ 347
METRIC RANK
12.4%
RECEIVING FOOD STAMPS
17.7/ 100
METRIC RATING
203rd/ 347
METRIC RANK
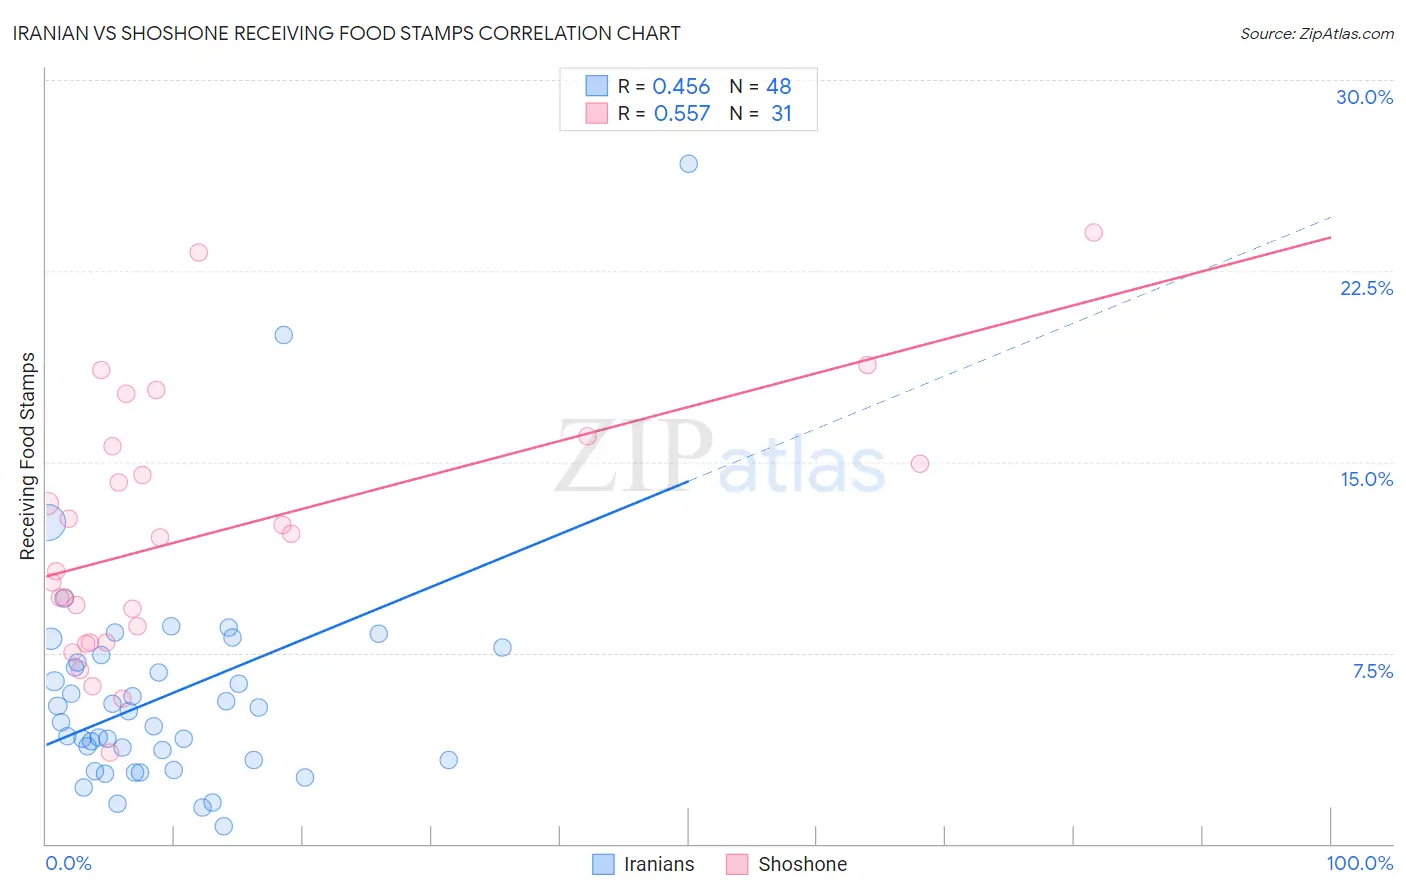
Iranian vs Shoshone Receiving Food Stamps Correlation Chart
The statistical analysis conducted on geographies consisting of 315,912,646 people shows a moderate positive correlation between the proportion of Iranians and percentage of population receiving government assistance and/or food stamps in the United States with a correlation coefficient (R) of 0.456 and weighted average of 7.9%. Similarly, the statistical analysis conducted on geographies consisting of 66,597,434 people shows a substantial positive correlation between the proportion of Shoshone and percentage of population receiving government assistance and/or food stamps in the United States with a correlation coefficient (R) of 0.557 and weighted average of 12.4%, a difference of 55.9%.
Receiving Food Stamps Correlation Summary
| Measurement | Iranian | Shoshone |
| Minimum | 0.70% | 3.6% |
| Maximum | 26.7% | 24.0% |
| Range | 26.0% | 20.4% |
| Mean | 5.9% | 12.2% |
| Median | 5.0% | 12.0% |
| Interquartile 25% (IQ1) | 3.3% | 7.9% |
| Interquartile 75% (IQ3) | 7.3% | 15.6% |
| Interquartile Range (IQR) | 4.0% | 7.7% |
| Standard Deviation (Sample) | 4.5% | 5.0% |
| Standard Deviation (Population) | 4.4% | 4.9% |
Similar Demographics by Receiving Food Stamps
Demographics Similar to Iranians by Receiving Food Stamps
In terms of receiving food stamps, the demographic groups most similar to Iranians are Thai (8.1%, a difference of 2.3%), Immigrants from Singapore (8.3%, a difference of 4.6%), Immigrants from Iran (8.3%, a difference of 5.2%), Filipino (7.4%, a difference of 7.3%), and Immigrants from India (7.4%, a difference of 7.6%).
| Demographics | Rating | Rank | Receiving Food Stamps |
| Immigrants | Taiwan | 100.0 /100 | #1 | Exceptional 7.3% |
| Immigrants | India | 100.0 /100 | #2 | Exceptional 7.4% |
| Filipinos | 100.0 /100 | #3 | Exceptional 7.4% |
| Iranians | 100.0 /100 | #4 | Exceptional 7.9% |
| Thais | 100.0 /100 | #5 | Exceptional 8.1% |
| Immigrants | Singapore | 100.0 /100 | #6 | Exceptional 8.3% |
| Immigrants | Iran | 100.0 /100 | #7 | Exceptional 8.3% |
| Burmese | 99.9 /100 | #8 | Exceptional 8.6% |
| Immigrants | Korea | 99.9 /100 | #9 | Exceptional 8.7% |
| Immigrants | South Central Asia | 99.9 /100 | #10 | Exceptional 8.8% |
| Okinawans | 99.9 /100 | #11 | Exceptional 8.9% |
| Cypriots | 99.9 /100 | #12 | Exceptional 8.9% |
| Bulgarians | 99.9 /100 | #13 | Exceptional 8.9% |
| Maltese | 99.9 /100 | #14 | Exceptional 8.9% |
| Norwegians | 99.9 /100 | #15 | Exceptional 9.0% |
Demographics Similar to Shoshone by Receiving Food Stamps
In terms of receiving food stamps, the demographic groups most similar to Shoshone are Nonimmigrants (12.4%, a difference of 0.030%), Aleut (12.4%, a difference of 0.090%), Immigrants from Thailand (12.4%, a difference of 0.16%), South American (12.4%, a difference of 0.42%), and Immigrants from Venezuela (12.3%, a difference of 0.53%).
| Demographics | Rating | Rank | Receiving Food Stamps |
| Iraqis | 26.6 /100 | #196 | Fair 12.2% |
| Delaware | 26.1 /100 | #197 | Fair 12.2% |
| Immigrants | Costa Rica | 25.4 /100 | #198 | Fair 12.2% |
| Portuguese | 25.1 /100 | #199 | Fair 12.2% |
| Sierra Leoneans | 23.6 /100 | #200 | Fair 12.2% |
| Ugandans | 22.5 /100 | #201 | Fair 12.2% |
| Immigrants | Venezuela | 20.1 /100 | #202 | Fair 12.3% |
| Shoshone | 17.7 /100 | #203 | Poor 12.4% |
| Immigrants | Nonimmigrants | 17.6 /100 | #204 | Poor 12.4% |
| Aleuts | 17.3 /100 | #205 | Poor 12.4% |
| Immigrants | Thailand | 17.0 /100 | #206 | Poor 12.4% |
| South Americans | 16.0 /100 | #207 | Poor 12.4% |
| Potawatomi | 14.6 /100 | #208 | Poor 12.5% |
| Immigrants | Sierra Leone | 12.9 /100 | #209 | Poor 12.5% |
| Immigrants | Uruguay | 12.8 /100 | #210 | Poor 12.5% |