Iranian vs Immigrants from Bolivia 1st Grade
COMPARE
Iranian
Immigrants from Bolivia
1st Grade
1st Grade Comparison
Iranians
Immigrants from Bolivia
98.2%
1ST GRADE
96.0/ 100
METRIC RATING
115th/ 347
METRIC RANK
97.4%
1ST GRADE
0.2/ 100
METRIC RATING
273rd/ 347
METRIC RANK
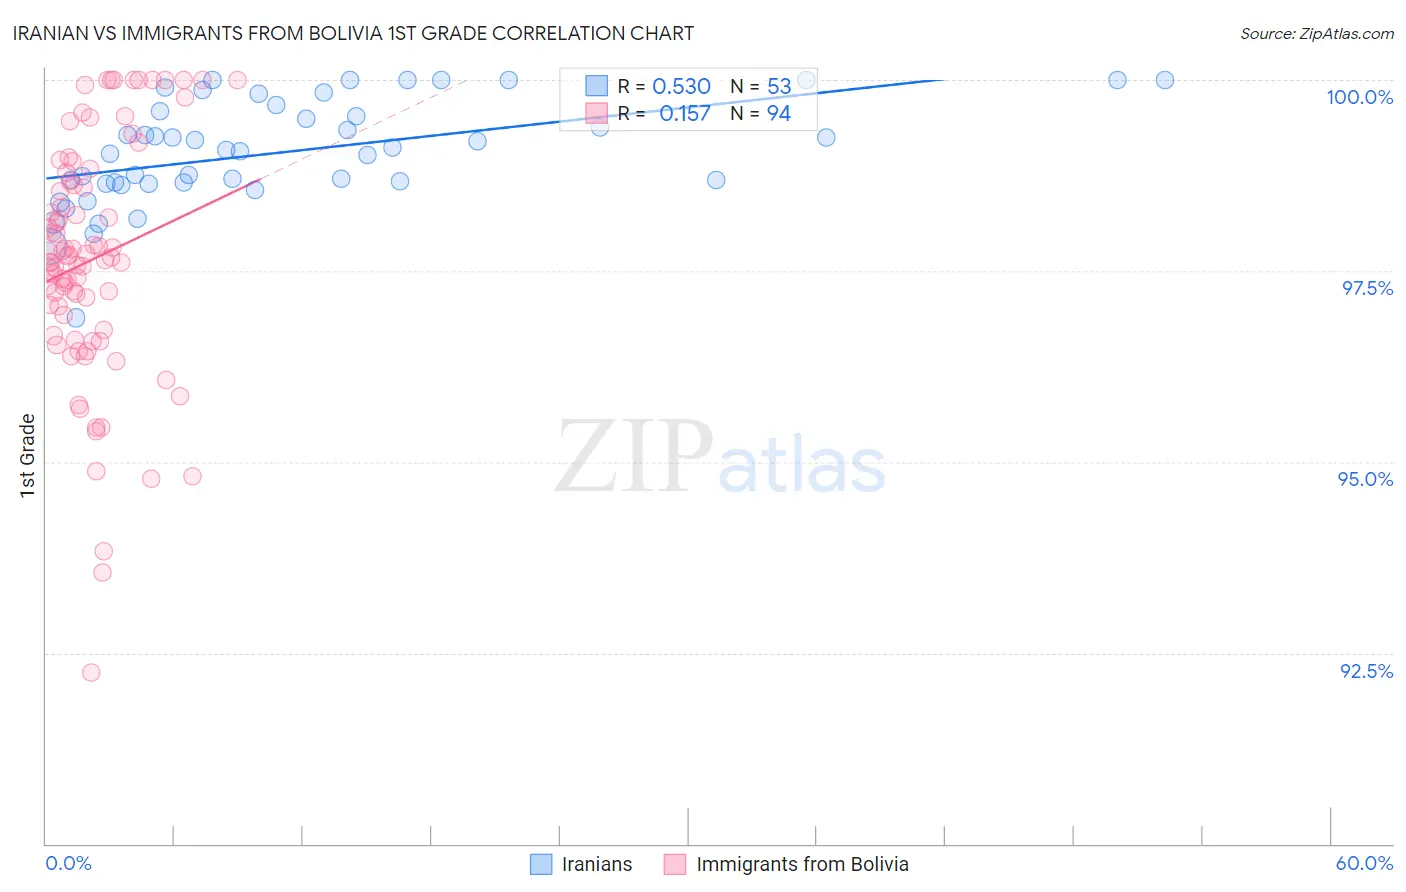
Iranian vs Immigrants from Bolivia 1st Grade Correlation Chart
The statistical analysis conducted on geographies consisting of 316,902,340 people shows a substantial positive correlation between the proportion of Iranians and percentage of population with at least 1st grade education in the United States with a correlation coefficient (R) of 0.530 and weighted average of 98.2%. Similarly, the statistical analysis conducted on geographies consisting of 158,728,833 people shows a poor positive correlation between the proportion of Immigrants from Bolivia and percentage of population with at least 1st grade education in the United States with a correlation coefficient (R) of 0.157 and weighted average of 97.4%, a difference of 0.74%.
1st Grade Correlation Summary
| Measurement | Iranian | Immigrants from Bolivia |
| Minimum | 96.9% | 92.2% |
| Maximum | 100.0% | 100.0% |
| Range | 3.1% | 7.8% |
| Mean | 99.1% | 97.6% |
| Median | 99.1% | 97.7% |
| Interquartile 25% (IQ1) | 98.7% | 96.7% |
| Interquartile 75% (IQ3) | 99.6% | 98.7% |
| Interquartile Range (IQR) | 0.98% | 1.9% |
| Standard Deviation (Sample) | 0.69% | 1.6% |
| Standard Deviation (Population) | 0.68% | 1.6% |
Similar Demographics by 1st Grade
Demographics Similar to Iranians by 1st Grade
In terms of 1st grade, the demographic groups most similar to Iranians are Ute (98.2%, a difference of 0.0%), Spanish (98.2%, a difference of 0.0%), Immigrants from Singapore (98.2%, a difference of 0.010%), Immigrants from Czechoslovakia (98.2%, a difference of 0.010%), and Immigrants from Norway (98.2%, a difference of 0.010%).
| Demographics | Rating | Rank | 1st Grade |
| Bhutanese | 97.3 /100 | #108 | Exceptional 98.2% |
| German Russians | 97.1 /100 | #109 | Exceptional 98.2% |
| Immigrants | Singapore | 96.7 /100 | #110 | Exceptional 98.2% |
| Immigrants | Czechoslovakia | 96.6 /100 | #111 | Exceptional 98.2% |
| Immigrants | Norway | 96.6 /100 | #112 | Exceptional 98.2% |
| Immigrants | Latvia | 96.4 /100 | #113 | Exceptional 98.2% |
| Ute | 96.2 /100 | #114 | Exceptional 98.2% |
| Iranians | 96.0 /100 | #115 | Exceptional 98.2% |
| Spanish | 95.9 /100 | #116 | Exceptional 98.2% |
| Yugoslavians | 95.5 /100 | #117 | Exceptional 98.2% |
| Immigrants | France | 95.5 /100 | #118 | Exceptional 98.2% |
| Thais | 94.7 /100 | #119 | Exceptional 98.1% |
| Okinawans | 94.5 /100 | #120 | Exceptional 98.1% |
| Immigrants | Zimbabwe | 94.0 /100 | #121 | Exceptional 98.1% |
| Menominee | 93.9 /100 | #122 | Exceptional 98.1% |
Demographics Similar to Immigrants from Bolivia by 1st Grade
In terms of 1st grade, the demographic groups most similar to Immigrants from Bolivia are Immigrants from Cameroon (97.4%, a difference of 0.0%), Immigrants from Peru (97.4%, a difference of 0.0%), Immigrants from Jamaica (97.5%, a difference of 0.020%), Ghanaian (97.4%, a difference of 0.030%), and Immigrants from China (97.4%, a difference of 0.030%).
| Demographics | Rating | Rank | 1st Grade |
| Immigrants | Liberia | 0.3 /100 | #266 | Tragic 97.5% |
| Immigrants | Sierra Leone | 0.3 /100 | #267 | Tragic 97.5% |
| Immigrants | Nigeria | 0.3 /100 | #268 | Tragic 97.5% |
| West Indians | 0.3 /100 | #269 | Tragic 97.5% |
| Immigrants | Jamaica | 0.2 /100 | #270 | Tragic 97.5% |
| Immigrants | Cameroon | 0.2 /100 | #271 | Tragic 97.4% |
| Immigrants | Peru | 0.2 /100 | #272 | Tragic 97.4% |
| Immigrants | Bolivia | 0.2 /100 | #273 | Tragic 97.4% |
| Ghanaians | 0.1 /100 | #274 | Tragic 97.4% |
| Immigrants | China | 0.1 /100 | #275 | Tragic 97.4% |
| Immigrants | Philippines | 0.1 /100 | #276 | Tragic 97.4% |
| Immigrants | Western Africa | 0.1 /100 | #277 | Tragic 97.4% |
| Immigrants | Uzbekistan | 0.1 /100 | #278 | Tragic 97.4% |
| Immigrants | Ghana | 0.1 /100 | #279 | Tragic 97.4% |
| Afghans | 0.1 /100 | #280 | Tragic 97.4% |