Inupiat vs Immigrants from Argentina Single Mother Poverty
COMPARE
Inupiat
Immigrants from Argentina
Single Mother Poverty
Single Mother Poverty Comparison
Inupiat
Immigrants from Argentina
29.0%
SINGLE MOTHER POVERTY
60.4/ 100
METRIC RATING
166th/ 347
METRIC RANK
27.1%
SINGLE MOTHER POVERTY
99.7/ 100
METRIC RATING
51st/ 347
METRIC RANK
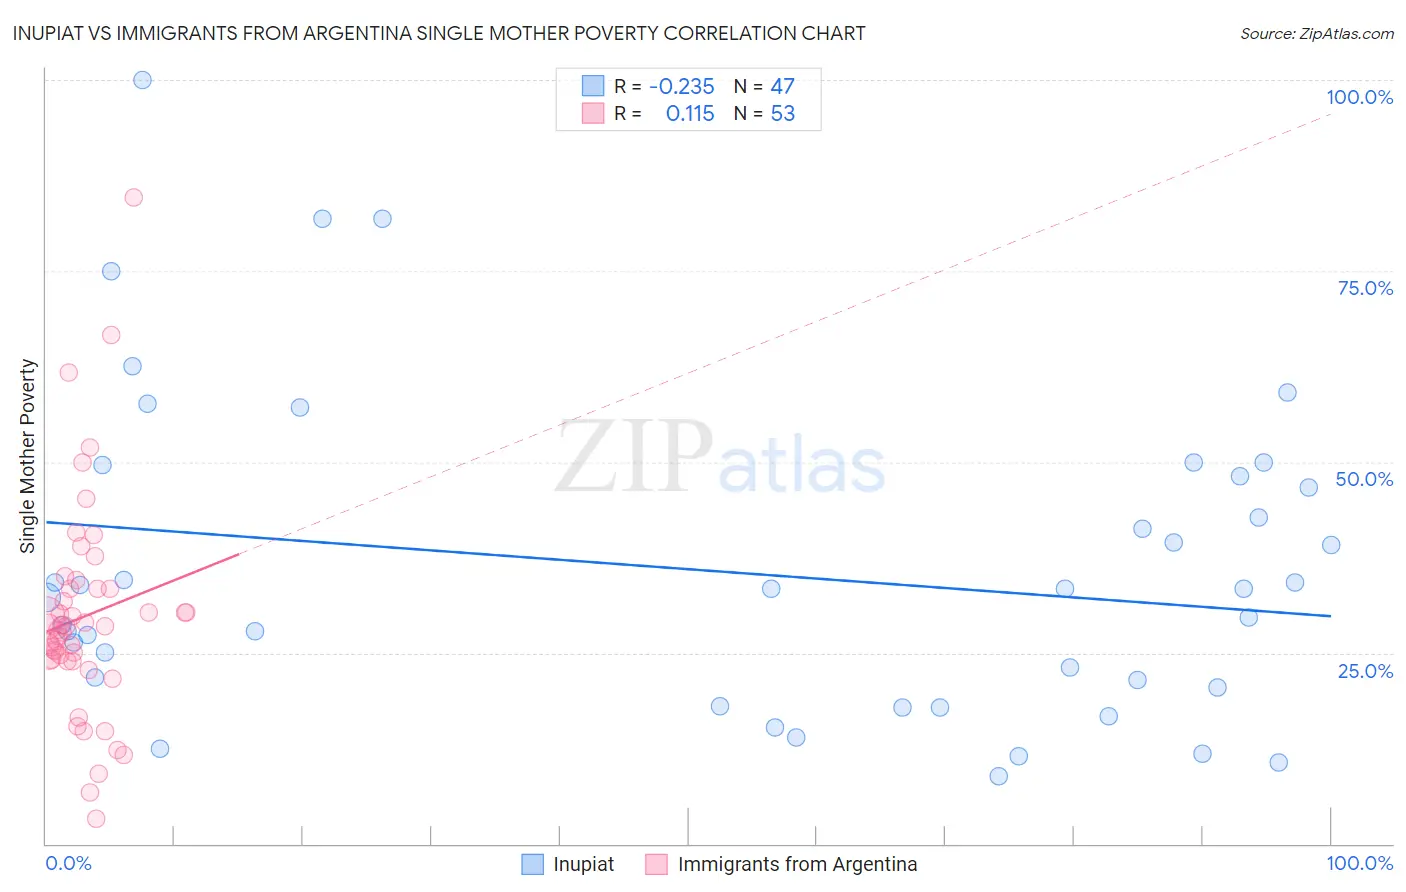
Inupiat vs Immigrants from Argentina Single Mother Poverty Correlation Chart
The statistical analysis conducted on geographies consisting of 95,875,547 people shows a weak negative correlation between the proportion of Inupiat and poverty level among single mothers in the United States with a correlation coefficient (R) of -0.235 and weighted average of 29.0%. Similarly, the statistical analysis conducted on geographies consisting of 259,658,600 people shows a poor positive correlation between the proportion of Immigrants from Argentina and poverty level among single mothers in the United States with a correlation coefficient (R) of 0.115 and weighted average of 27.1%, a difference of 7.1%.
Single Mother Poverty Correlation Summary
| Measurement | Inupiat | Immigrants from Argentina |
| Minimum | 8.8% | 3.3% |
| Maximum | 100.0% | 84.6% |
| Range | 91.2% | 81.3% |
| Mean | 35.8% | 29.7% |
| Median | 33.3% | 28.5% |
| Interquartile 25% (IQ1) | 20.5% | 24.0% |
| Interquartile 75% (IQ3) | 48.1% | 33.3% |
| Interquartile Range (IQR) | 27.6% | 9.3% |
| Standard Deviation (Sample) | 20.7% | 14.2% |
| Standard Deviation (Population) | 20.5% | 14.1% |
Similar Demographics by Single Mother Poverty
Demographics Similar to Inupiat by Single Mother Poverty
In terms of single mother poverty, the demographic groups most similar to Inupiat are Arab (29.0%, a difference of 0.020%), Costa Rican (29.0%, a difference of 0.10%), European (29.1%, a difference of 0.14%), Immigrants from Uruguay (29.1%, a difference of 0.16%), and New Zealander (29.1%, a difference of 0.26%).
| Demographics | Rating | Rank | Single Mother Poverty |
| Czechs | 68.4 /100 | #159 | Good 28.9% |
| Japanese | 68.0 /100 | #160 | Good 28.9% |
| Immigrants | Cambodia | 66.6 /100 | #161 | Good 28.9% |
| Scandinavians | 66.2 /100 | #162 | Good 28.9% |
| Immigrants | Nigeria | 65.9 /100 | #163 | Good 28.9% |
| Immigrants | Kenya | 65.9 /100 | #164 | Good 28.9% |
| Arabs | 60.7 /100 | #165 | Good 29.0% |
| Inupiat | 60.4 /100 | #166 | Good 29.0% |
| Costa Ricans | 58.4 /100 | #167 | Average 29.0% |
| Europeans | 57.6 /100 | #168 | Average 29.1% |
| Immigrants | Uruguay | 57.2 /100 | #169 | Average 29.1% |
| New Zealanders | 55.1 /100 | #170 | Average 29.1% |
| Puget Sound Salish | 55.1 /100 | #171 | Average 29.1% |
| Carpatho Rusyns | 53.8 /100 | #172 | Average 29.1% |
| British | 50.6 /100 | #173 | Average 29.2% |
Demographics Similar to Immigrants from Argentina by Single Mother Poverty
In terms of single mother poverty, the demographic groups most similar to Immigrants from Argentina are Immigrants from South Eastern Asia (27.1%, a difference of 0.040%), Immigrants from Jordan (27.1%, a difference of 0.080%), Immigrants from Bulgaria (27.1%, a difference of 0.11%), Immigrants from Egypt (27.1%, a difference of 0.14%), and Immigrants from Romania (27.2%, a difference of 0.19%).
| Demographics | Rating | Rank | Single Mother Poverty |
| Immigrants | Sierra Leone | 99.9 /100 | #44 | Exceptional 26.9% |
| Latvians | 99.9 /100 | #45 | Exceptional 26.9% |
| Immigrants | Serbia | 99.9 /100 | #46 | Exceptional 26.9% |
| Egyptians | 99.8 /100 | #47 | Exceptional 26.9% |
| Immigrants | Poland | 99.8 /100 | #48 | Exceptional 26.9% |
| Cambodians | 99.8 /100 | #49 | Exceptional 27.0% |
| Laotians | 99.8 /100 | #50 | Exceptional 27.0% |
| Immigrants | Argentina | 99.7 /100 | #51 | Exceptional 27.1% |
| Immigrants | South Eastern Asia | 99.7 /100 | #52 | Exceptional 27.1% |
| Immigrants | Jordan | 99.7 /100 | #53 | Exceptional 27.1% |
| Immigrants | Bulgaria | 99.7 /100 | #54 | Exceptional 27.1% |
| Immigrants | Egypt | 99.7 /100 | #55 | Exceptional 27.1% |
| Immigrants | Romania | 99.7 /100 | #56 | Exceptional 27.2% |
| Palestinians | 99.7 /100 | #57 | Exceptional 27.2% |
| Argentineans | 99.6 /100 | #58 | Exceptional 27.2% |