Inupiat vs Immigrants from Canada Single Mother Poverty
COMPARE
Inupiat
Immigrants from Canada
Single Mother Poverty
Single Mother Poverty Comparison
Inupiat
Immigrants from Canada
29.0%
SINGLE MOTHER POVERTY
60.4/ 100
METRIC RATING
166th/ 347
METRIC RANK
28.4%
SINGLE MOTHER POVERTY
88.9/ 100
METRIC RATING
137th/ 347
METRIC RANK
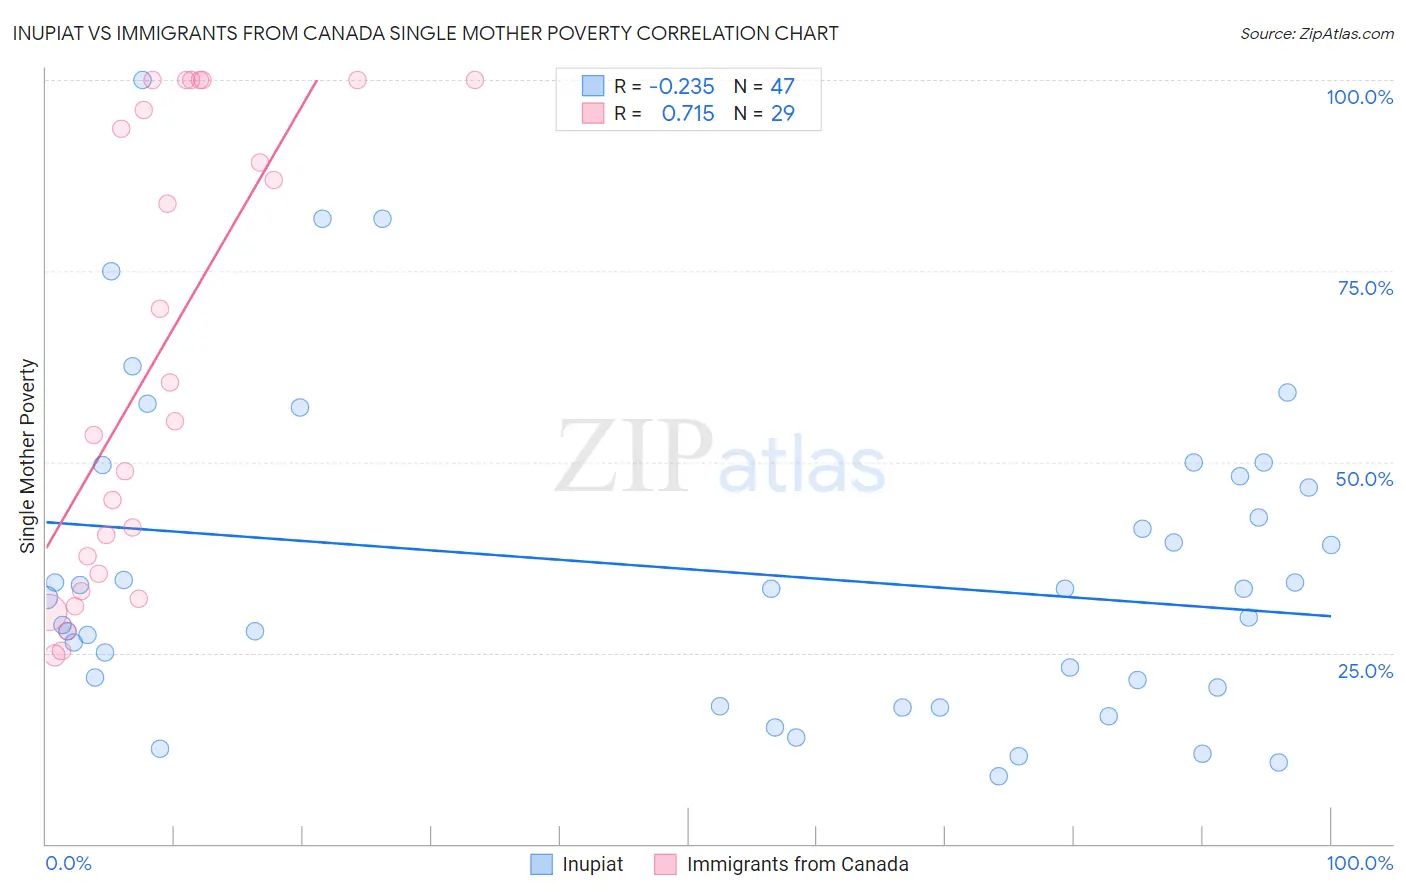
Inupiat vs Immigrants from Canada Single Mother Poverty Correlation Chart
The statistical analysis conducted on geographies consisting of 95,875,547 people shows a weak negative correlation between the proportion of Inupiat and poverty level among single mothers in the United States with a correlation coefficient (R) of -0.235 and weighted average of 29.0%. Similarly, the statistical analysis conducted on geographies consisting of 443,447,925 people shows a strong positive correlation between the proportion of Immigrants from Canada and poverty level among single mothers in the United States with a correlation coefficient (R) of 0.715 and weighted average of 28.4%, a difference of 2.0%.
Single Mother Poverty Correlation Summary
| Measurement | Inupiat | Immigrants from Canada |
| Minimum | 8.8% | 24.7% |
| Maximum | 100.0% | 100.0% |
| Range | 91.2% | 75.3% |
| Mean | 35.8% | 63.5% |
| Median | 33.3% | 55.4% |
| Interquartile 25% (IQ1) | 20.5% | 34.3% |
| Interquartile 75% (IQ3) | 48.1% | 98.0% |
| Interquartile Range (IQR) | 27.6% | 63.8% |
| Standard Deviation (Sample) | 20.7% | 29.6% |
| Standard Deviation (Population) | 20.5% | 29.1% |
Similar Demographics by Single Mother Poverty
Demographics Similar to Inupiat by Single Mother Poverty
In terms of single mother poverty, the demographic groups most similar to Inupiat are Arab (29.0%, a difference of 0.020%), Costa Rican (29.0%, a difference of 0.10%), European (29.1%, a difference of 0.14%), Immigrants from Uruguay (29.1%, a difference of 0.16%), and New Zealander (29.1%, a difference of 0.26%).
| Demographics | Rating | Rank | Single Mother Poverty |
| Czechs | 68.4 /100 | #159 | Good 28.9% |
| Japanese | 68.0 /100 | #160 | Good 28.9% |
| Immigrants | Cambodia | 66.6 /100 | #161 | Good 28.9% |
| Scandinavians | 66.2 /100 | #162 | Good 28.9% |
| Immigrants | Nigeria | 65.9 /100 | #163 | Good 28.9% |
| Immigrants | Kenya | 65.9 /100 | #164 | Good 28.9% |
| Arabs | 60.7 /100 | #165 | Good 29.0% |
| Inupiat | 60.4 /100 | #166 | Good 29.0% |
| Costa Ricans | 58.4 /100 | #167 | Average 29.0% |
| Europeans | 57.6 /100 | #168 | Average 29.1% |
| Immigrants | Uruguay | 57.2 /100 | #169 | Average 29.1% |
| New Zealanders | 55.1 /100 | #170 | Average 29.1% |
| Puget Sound Salish | 55.1 /100 | #171 | Average 29.1% |
| Carpatho Rusyns | 53.8 /100 | #172 | Average 29.1% |
| British | 50.6 /100 | #173 | Average 29.2% |
Demographics Similar to Immigrants from Canada by Single Mother Poverty
In terms of single mother poverty, the demographic groups most similar to Immigrants from Canada are Native Hawaiian (28.4%, a difference of 0.0%), Immigrants from Southern Europe (28.4%, a difference of 0.040%), Immigrants from Spain (28.4%, a difference of 0.040%), Immigrants from Belgium (28.5%, a difference of 0.050%), and Immigrants from Morocco (28.4%, a difference of 0.070%).
| Demographics | Rating | Rank | Single Mother Poverty |
| Norwegians | 90.4 /100 | #130 | Exceptional 28.4% |
| Immigrants | Austria | 90.3 /100 | #131 | Exceptional 28.4% |
| Immigrants | Morocco | 89.5 /100 | #132 | Excellent 28.4% |
| Swedes | 89.4 /100 | #133 | Excellent 28.4% |
| Immigrants | Southern Europe | 89.2 /100 | #134 | Excellent 28.4% |
| Immigrants | Spain | 89.2 /100 | #135 | Excellent 28.4% |
| Native Hawaiians | 88.9 /100 | #136 | Excellent 28.4% |
| Immigrants | Canada | 88.9 /100 | #137 | Excellent 28.4% |
| Immigrants | Belgium | 88.5 /100 | #138 | Excellent 28.5% |
| Samoans | 88.1 /100 | #139 | Excellent 28.5% |
| Immigrants | Colombia | 88.0 /100 | #140 | Excellent 28.5% |
| Danes | 87.1 /100 | #141 | Excellent 28.5% |
| South Africans | 86.6 /100 | #142 | Excellent 28.5% |
| Immigrants | North America | 86.5 /100 | #143 | Excellent 28.5% |
| Luxembourgers | 86.4 /100 | #144 | Excellent 28.5% |