Indonesian vs Immigrants from St. Vincent and the Grenadines Female Poverty Among 18-24 Year Olds
COMPARE
Indonesian
Immigrants from St. Vincent and the Grenadines
Female Poverty Among 18-24 Year Olds
Female Poverty Among 18-24 Year Olds Comparison
Indonesians
Immigrants from St. Vincent and the Grenadines
22.5%
FEMALE POVERTY AMONG 18-24 YEAR OLDS
0.0/ 100
METRIC RATING
294th/ 347
METRIC RANK
20.8%
FEMALE POVERTY AMONG 18-24 YEAR OLDS
6.0/ 100
METRIC RATING
231st/ 347
METRIC RANK
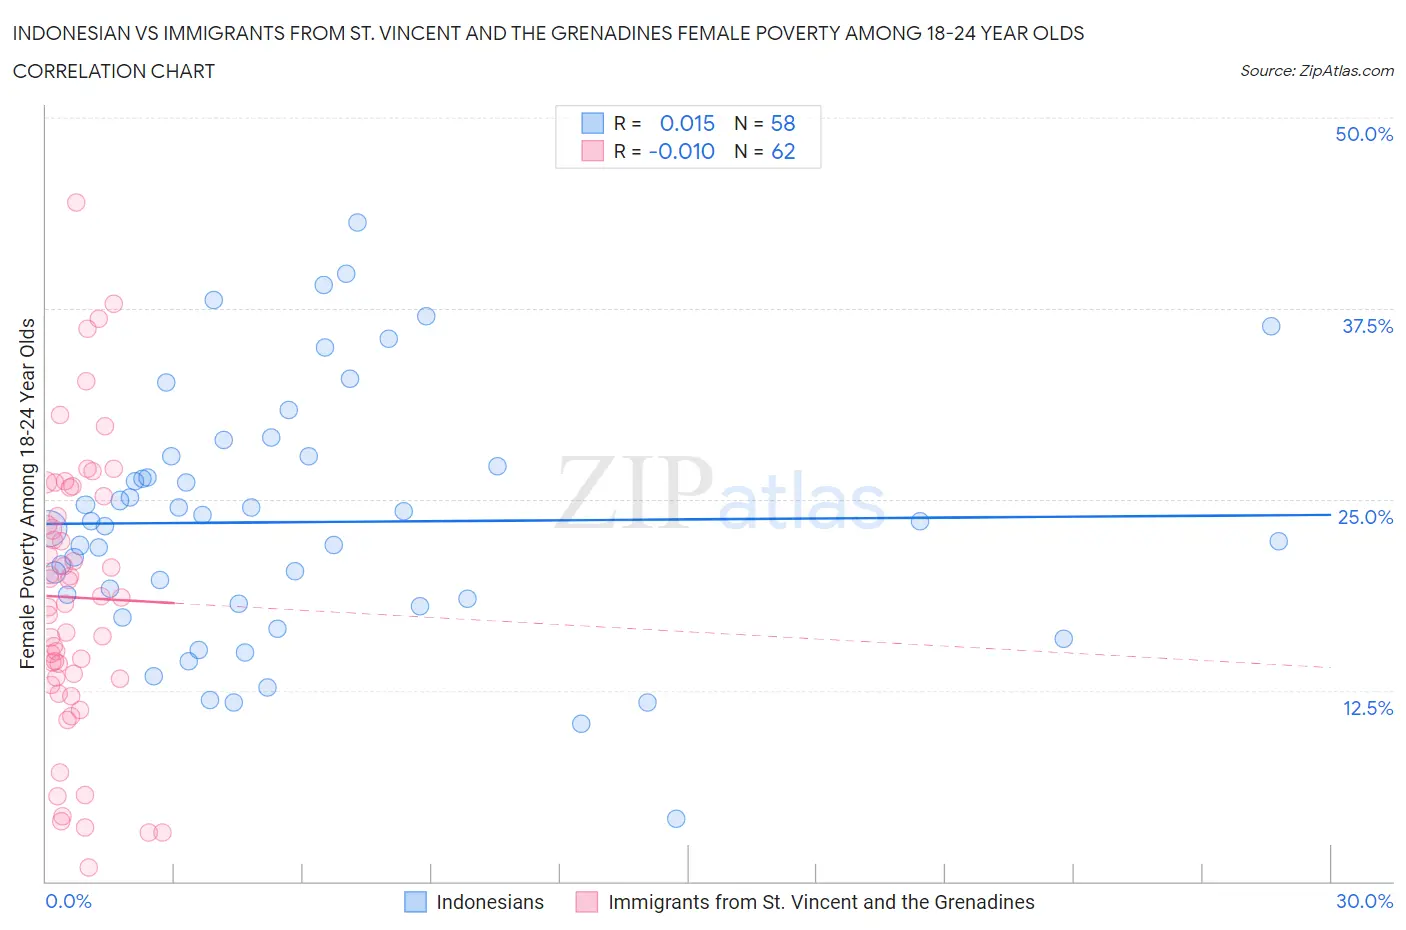
Indonesian vs Immigrants from St. Vincent and the Grenadines Female Poverty Among 18-24 Year Olds Correlation Chart
The statistical analysis conducted on geographies consisting of 161,434,241 people shows no correlation between the proportion of Indonesians and poverty level among females between the ages 18 and 24 in the United States with a correlation coefficient (R) of 0.015 and weighted average of 22.5%. Similarly, the statistical analysis conducted on geographies consisting of 56,017,716 people shows no correlation between the proportion of Immigrants from St. Vincent and the Grenadines and poverty level among females between the ages 18 and 24 in the United States with a correlation coefficient (R) of -0.010 and weighted average of 20.8%, a difference of 8.2%.
Female Poverty Among 18-24 Year Olds Correlation Summary
| Measurement | Indonesian | Immigrants from St. Vincent and the Grenadines |
| Minimum | 4.1% | 0.92% |
| Maximum | 43.2% | 44.4% |
| Range | 39.1% | 43.5% |
| Mean | 23.5% | 18.6% |
| Median | 23.4% | 18.3% |
| Interquartile 25% (IQ1) | 18.2% | 13.3% |
| Interquartile 75% (IQ3) | 27.8% | 25.2% |
| Interquartile Range (IQR) | 9.6% | 12.0% |
| Standard Deviation (Sample) | 8.2% | 9.2% |
| Standard Deviation (Population) | 8.1% | 9.2% |
Similar Demographics by Female Poverty Among 18-24 Year Olds
Demographics Similar to Indonesians by Female Poverty Among 18-24 Year Olds
In terms of female poverty among 18-24 year olds, the demographic groups most similar to Indonesians are U.S. Virgin Islander (22.5%, a difference of 0.030%), Alaskan Athabascan (22.5%, a difference of 0.070%), Bangladeshi (22.5%, a difference of 0.12%), Shoshone (22.5%, a difference of 0.12%), and Menominee (22.5%, a difference of 0.23%).
| Demographics | Rating | Rank | Female Poverty Among 18-24 Year Olds |
| Immigrants | Middle Africa | 0.0 /100 | #287 | Tragic 22.1% |
| Dominicans | 0.0 /100 | #288 | Tragic 22.3% |
| French American Indians | 0.0 /100 | #289 | Tragic 22.3% |
| Immigrants | Senegal | 0.0 /100 | #290 | Tragic 22.4% |
| Bangladeshis | 0.0 /100 | #291 | Tragic 22.5% |
| Alaskan Athabascans | 0.0 /100 | #292 | Tragic 22.5% |
| U.S. Virgin Islanders | 0.0 /100 | #293 | Tragic 22.5% |
| Indonesians | 0.0 /100 | #294 | Tragic 22.5% |
| Shoshone | 0.0 /100 | #295 | Tragic 22.5% |
| Menominee | 0.0 /100 | #296 | Tragic 22.5% |
| Inupiat | 0.0 /100 | #297 | Tragic 22.6% |
| Central American Indians | 0.0 /100 | #298 | Tragic 22.6% |
| Cherokee | 0.0 /100 | #299 | Tragic 22.7% |
| Africans | 0.0 /100 | #300 | Tragic 22.8% |
| Seminole | 0.0 /100 | #301 | Tragic 22.9% |
Demographics Similar to Immigrants from St. Vincent and the Grenadines by Female Poverty Among 18-24 Year Olds
In terms of female poverty among 18-24 year olds, the demographic groups most similar to Immigrants from St. Vincent and the Grenadines are Finnish (20.8%, a difference of 0.0%), White/Caucasian (20.8%, a difference of 0.020%), Australian (20.8%, a difference of 0.030%), Immigrants from Denmark (20.8%, a difference of 0.040%), and Ghanaian (20.8%, a difference of 0.090%).
| Demographics | Rating | Rank | Female Poverty Among 18-24 Year Olds |
| Immigrants | Liberia | 7.6 /100 | #224 | Tragic 20.7% |
| Norwegians | 7.3 /100 | #225 | Tragic 20.7% |
| Estonians | 7.2 /100 | #226 | Tragic 20.7% |
| Immigrants | Sweden | 6.8 /100 | #227 | Tragic 20.7% |
| Ghanaians | 6.5 /100 | #228 | Tragic 20.8% |
| Australians | 6.1 /100 | #229 | Tragic 20.8% |
| Whites/Caucasians | 6.1 /100 | #230 | Tragic 20.8% |
| Immigrants | St. Vincent and the Grenadines | 6.0 /100 | #231 | Tragic 20.8% |
| Finns | 6.0 /100 | #232 | Tragic 20.8% |
| Immigrants | Denmark | 5.8 /100 | #233 | Tragic 20.8% |
| Welsh | 5.4 /100 | #234 | Tragic 20.8% |
| Immigrants | Uganda | 5.1 /100 | #235 | Tragic 20.8% |
| Okinawans | 4.9 /100 | #236 | Tragic 20.8% |
| Scottish | 4.5 /100 | #237 | Tragic 20.9% |
| Immigrants | Singapore | 4.4 /100 | #238 | Tragic 20.9% |