Indonesian vs Choctaw Female Poverty Among 18-24 Year Olds
COMPARE
Indonesian
Choctaw
Female Poverty Among 18-24 Year Olds
Female Poverty Among 18-24 Year Olds Comparison
Indonesians
Choctaw
22.5%
FEMALE POVERTY AMONG 18-24 YEAR OLDS
0.0/ 100
METRIC RATING
294th/ 347
METRIC RANK
24.3%
FEMALE POVERTY AMONG 18-24 YEAR OLDS
0.0/ 100
METRIC RATING
314th/ 347
METRIC RANK
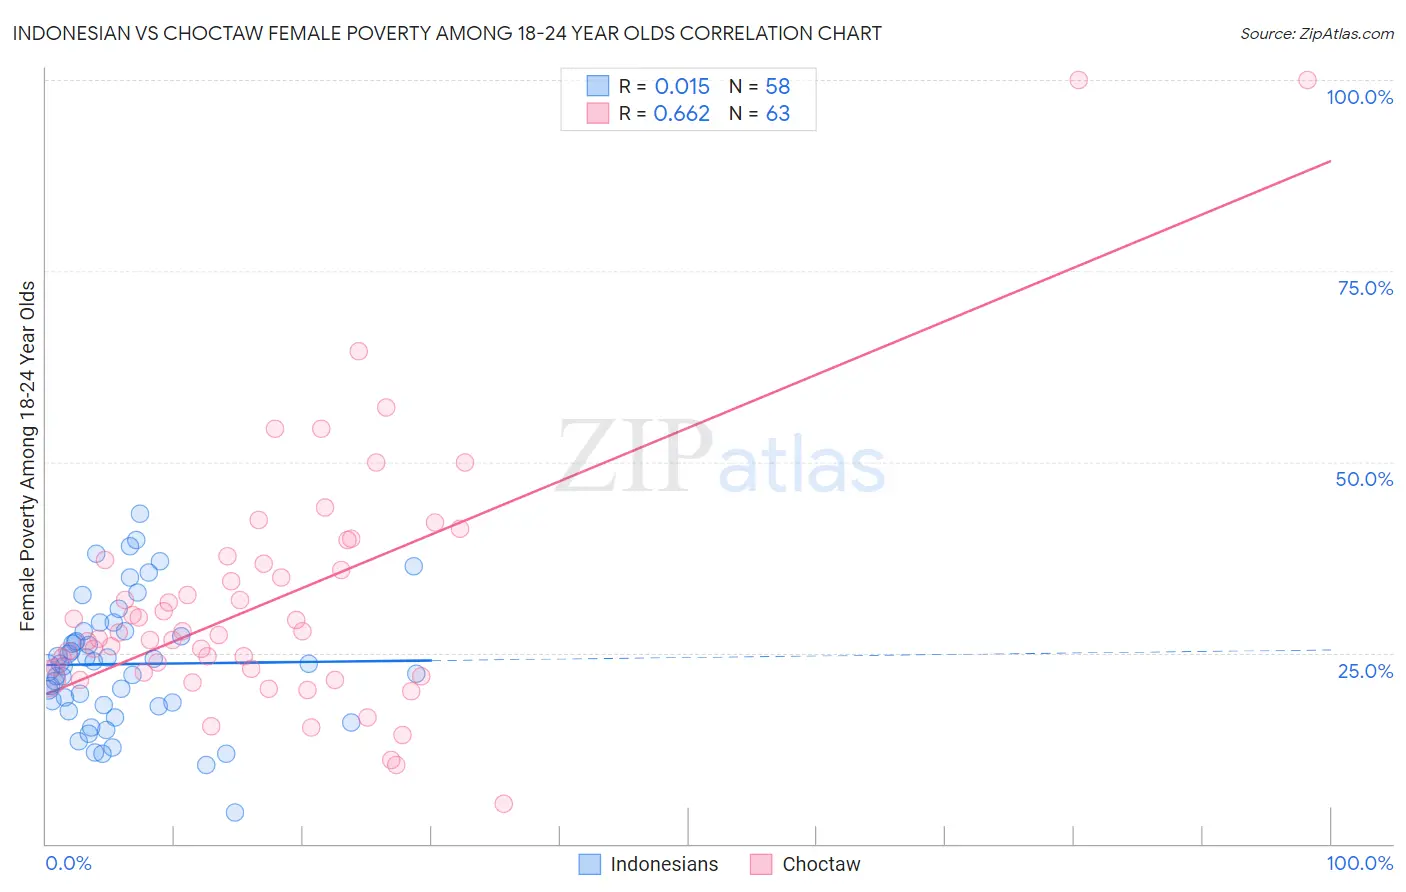
Indonesian vs Choctaw Female Poverty Among 18-24 Year Olds Correlation Chart
The statistical analysis conducted on geographies consisting of 161,434,241 people shows no correlation between the proportion of Indonesians and poverty level among females between the ages 18 and 24 in the United States with a correlation coefficient (R) of 0.015 and weighted average of 22.5%. Similarly, the statistical analysis conducted on geographies consisting of 265,726,107 people shows a significant positive correlation between the proportion of Choctaw and poverty level among females between the ages 18 and 24 in the United States with a correlation coefficient (R) of 0.662 and weighted average of 24.3%, a difference of 7.9%.
Female Poverty Among 18-24 Year Olds Correlation Summary
| Measurement | Indonesian | Choctaw |
| Minimum | 4.1% | 5.3% |
| Maximum | 43.2% | 100.0% |
| Range | 39.1% | 94.7% |
| Mean | 23.5% | 32.0% |
| Median | 23.4% | 27.7% |
| Interquartile 25% (IQ1) | 18.2% | 22.4% |
| Interquartile 75% (IQ3) | 27.8% | 37.2% |
| Interquartile Range (IQR) | 9.6% | 14.8% |
| Standard Deviation (Sample) | 8.2% | 17.0% |
| Standard Deviation (Population) | 8.1% | 16.8% |
Demographics Similar to Indonesians and Choctaw by Female Poverty Among 18-24 Year Olds
In terms of female poverty among 18-24 year olds, the demographic groups most similar to Indonesians are Shoshone (22.5%, a difference of 0.12%), Menominee (22.5%, a difference of 0.23%), Inupiat (22.6%, a difference of 0.37%), Central American Indian (22.6%, a difference of 0.44%), and Cherokee (22.7%, a difference of 0.85%). Similarly, the demographic groups most similar to Choctaw are Creek (24.2%, a difference of 0.16%), Yuman (24.0%, a difference of 1.2%), Potawatomi (23.7%, a difference of 2.4%), Comanche (23.6%, a difference of 2.7%), and Blackfeet (23.6%, a difference of 2.8%).
| Demographics | Rating | Rank | Female Poverty Among 18-24 Year Olds |
| Indonesians | 0.0 /100 | #294 | Tragic 22.5% |
| Shoshone | 0.0 /100 | #295 | Tragic 22.5% |
| Menominee | 0.0 /100 | #296 | Tragic 22.5% |
| Inupiat | 0.0 /100 | #297 | Tragic 22.6% |
| Central American Indians | 0.0 /100 | #298 | Tragic 22.6% |
| Cherokee | 0.0 /100 | #299 | Tragic 22.7% |
| Africans | 0.0 /100 | #300 | Tragic 22.8% |
| Seminole | 0.0 /100 | #301 | Tragic 22.9% |
| Iroquois | 0.0 /100 | #302 | Tragic 22.9% |
| Senegalese | 0.0 /100 | #303 | Tragic 23.0% |
| Sudanese | 0.0 /100 | #304 | Tragic 23.0% |
| Immigrants | Kuwait | 0.0 /100 | #305 | Tragic 23.0% |
| Paiute | 0.0 /100 | #306 | Tragic 23.3% |
| Cree | 0.0 /100 | #307 | Tragic 23.4% |
| Immigrants | Sudan | 0.0 /100 | #308 | Tragic 23.5% |
| Blackfeet | 0.0 /100 | #309 | Tragic 23.6% |
| Comanche | 0.0 /100 | #310 | Tragic 23.6% |
| Potawatomi | 0.0 /100 | #311 | Tragic 23.7% |
| Yuman | 0.0 /100 | #312 | Tragic 24.0% |
| Creek | 0.0 /100 | #313 | Tragic 24.2% |
| Choctaw | 0.0 /100 | #314 | Tragic 24.3% |