Bulgarian vs Colville Female Poverty Among 18-24 Year Olds
COMPARE
Bulgarian
Colville
Female Poverty Among 18-24 Year Olds
Female Poverty Among 18-24 Year Olds Comparison
Bulgarians
Colville
18.1%
FEMALE POVERTY AMONG 18-24 YEAR OLDS
100.0/ 100
METRIC RATING
42nd/ 347
METRIC RANK
29.0%
FEMALE POVERTY AMONG 18-24 YEAR OLDS
0.0/ 100
METRIC RATING
341st/ 347
METRIC RANK
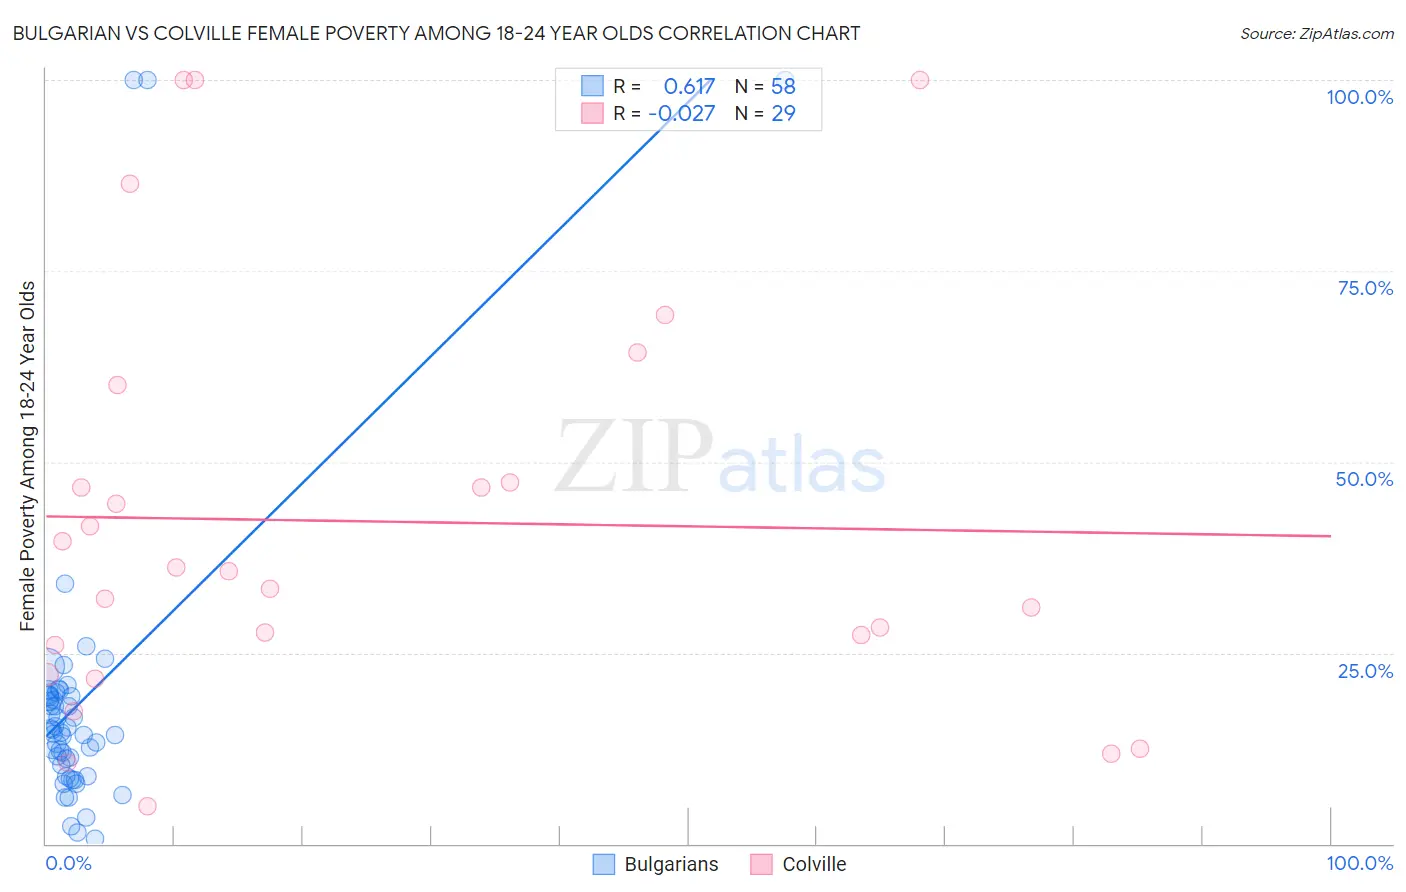
Bulgarian vs Colville Female Poverty Among 18-24 Year Olds Correlation Chart
The statistical analysis conducted on geographies consisting of 202,813,744 people shows a significant positive correlation between the proportion of Bulgarians and poverty level among females between the ages 18 and 24 in the United States with a correlation coefficient (R) of 0.617 and weighted average of 18.1%. Similarly, the statistical analysis conducted on geographies consisting of 34,585,372 people shows no correlation between the proportion of Colville and poverty level among females between the ages 18 and 24 in the United States with a correlation coefficient (R) of -0.027 and weighted average of 29.0%, a difference of 60.5%.
Female Poverty Among 18-24 Year Olds Correlation Summary
| Measurement | Bulgarian | Colville |
| Minimum | 0.62% | 4.9% |
| Maximum | 100.0% | 100.0% |
| Range | 99.4% | 95.1% |
| Mean | 18.8% | 42.2% |
| Median | 14.7% | 35.6% |
| Interquartile 25% (IQ1) | 10.4% | 24.1% |
| Interquartile 75% (IQ3) | 19.4% | 53.6% |
| Interquartile Range (IQR) | 9.0% | 29.6% |
| Standard Deviation (Sample) | 20.2% | 27.1% |
| Standard Deviation (Population) | 20.0% | 26.6% |
Similar Demographics by Female Poverty Among 18-24 Year Olds
Demographics Similar to Bulgarians by Female Poverty Among 18-24 Year Olds
In terms of female poverty among 18-24 year olds, the demographic groups most similar to Bulgarians are Macedonian (18.1%, a difference of 0.010%), Nicaraguan (18.1%, a difference of 0.090%), Spanish American Indian (18.1%, a difference of 0.18%), Immigrants from Argentina (18.0%, a difference of 0.47%), and Immigrants from Southern Europe (18.2%, a difference of 0.47%).
| Demographics | Rating | Rank | Female Poverty Among 18-24 Year Olds |
| Immigrants | Greece | 100.0 /100 | #35 | Exceptional 17.9% |
| Immigrants | South America | 100.0 /100 | #36 | Exceptional 17.9% |
| Immigrants | Croatia | 100.0 /100 | #37 | Exceptional 17.9% |
| South Americans | 100.0 /100 | #38 | Exceptional 18.0% |
| Puget Sound Salish | 100.0 /100 | #39 | Exceptional 18.0% |
| Immigrants | Romania | 100.0 /100 | #40 | Exceptional 18.0% |
| Immigrants | Argentina | 100.0 /100 | #41 | Exceptional 18.0% |
| Bulgarians | 100.0 /100 | #42 | Exceptional 18.1% |
| Macedonians | 100.0 /100 | #43 | Exceptional 18.1% |
| Nicaraguans | 100.0 /100 | #44 | Exceptional 18.1% |
| Spanish American Indians | 100.0 /100 | #45 | Exceptional 18.1% |
| Immigrants | Southern Europe | 100.0 /100 | #46 | Exceptional 18.2% |
| Asians | 100.0 /100 | #47 | Exceptional 18.2% |
| Sri Lankans | 100.0 /100 | #48 | Exceptional 18.2% |
| Bhutanese | 100.0 /100 | #49 | Exceptional 18.2% |
Demographics Similar to Colville by Female Poverty Among 18-24 Year Olds
In terms of female poverty among 18-24 year olds, the demographic groups most similar to Colville are Kiowa (29.2%, a difference of 0.74%), Sioux (28.6%, a difference of 1.6%), Pima (28.4%, a difference of 2.1%), Puerto Rican (29.8%, a difference of 2.8%), and Hopi (28.2%, a difference of 2.9%).
| Demographics | Rating | Rank | Female Poverty Among 18-24 Year Olds |
| Apache | 0.0 /100 | #333 | Tragic 26.3% |
| Pueblo | 0.0 /100 | #334 | Tragic 26.9% |
| Yup'ik | 0.0 /100 | #335 | Tragic 27.0% |
| Immigrants | Yemen | 0.0 /100 | #336 | Tragic 27.5% |
| Cheyenne | 0.0 /100 | #337 | Tragic 28.1% |
| Hopi | 0.0 /100 | #338 | Tragic 28.2% |
| Pima | 0.0 /100 | #339 | Tragic 28.4% |
| Sioux | 0.0 /100 | #340 | Tragic 28.6% |
| Colville | 0.0 /100 | #341 | Tragic 29.0% |
| Kiowa | 0.0 /100 | #342 | Tragic 29.2% |
| Puerto Ricans | 0.0 /100 | #343 | Tragic 29.8% |
| Navajo | 0.0 /100 | #344 | Tragic 30.3% |
| Tohono O'odham | 0.0 /100 | #345 | Tragic 31.0% |
| Lumbee | 0.0 /100 | #346 | Tragic 31.1% |
| Crow | 0.0 /100 | #347 | Tragic 33.2% |