Immigrants from Switzerland vs Bahamian Single Male Poverty
COMPARE
Immigrants from Switzerland
Bahamian
Single Male Poverty
Single Male Poverty Comparison
Immigrants from Switzerland
Bahamians
12.8%
SINGLE MALE POVERTY
43.1/ 100
METRIC RATING
178th/ 347
METRIC RANK
14.6%
SINGLE MALE POVERTY
0.0/ 100
METRIC RATING
291st/ 347
METRIC RANK
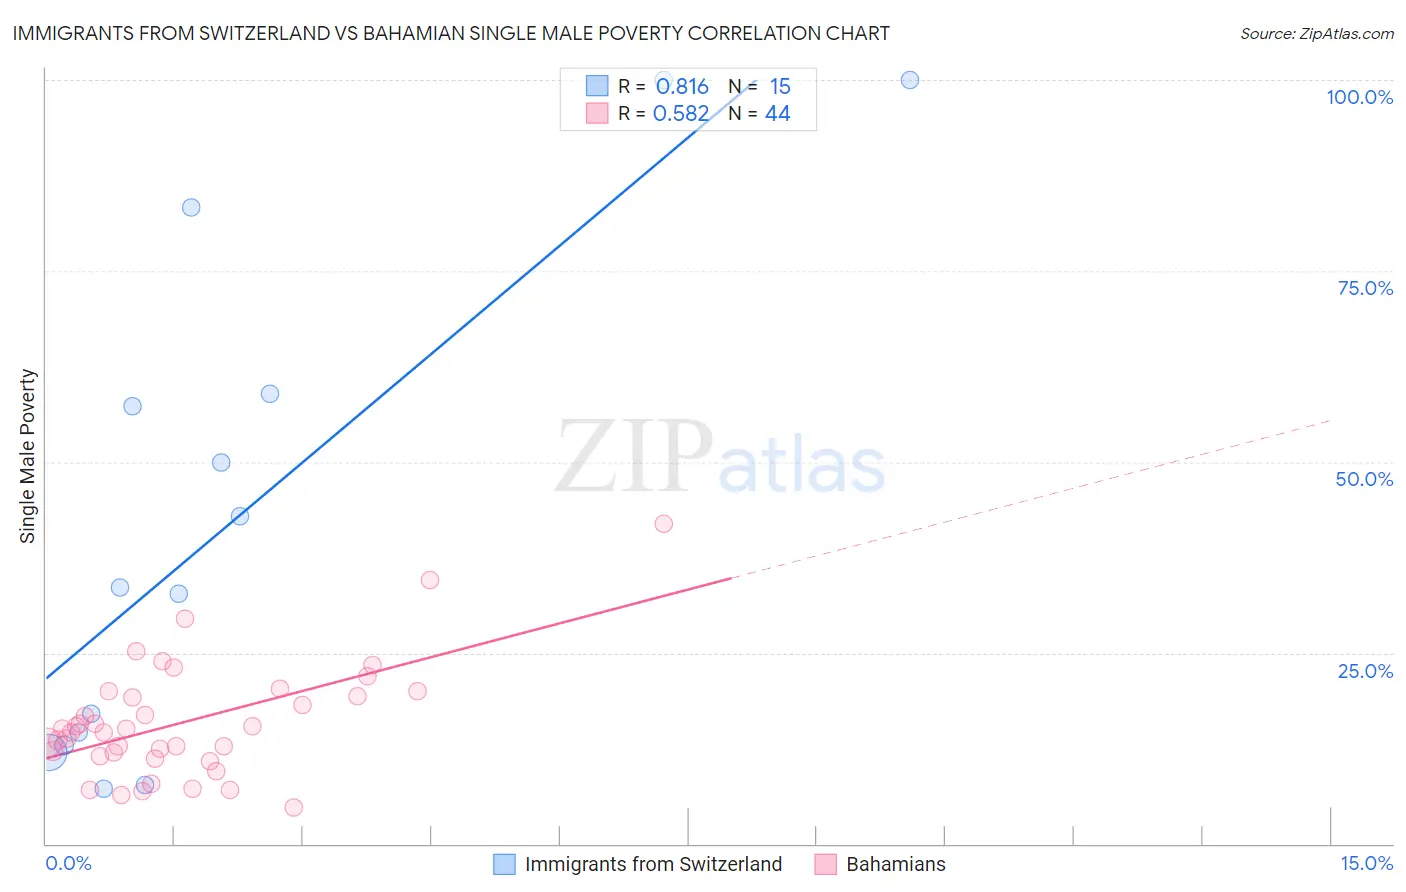
Immigrants from Switzerland vs Bahamian Single Male Poverty Correlation Chart
The statistical analysis conducted on geographies consisting of 136,371,687 people shows a very strong positive correlation between the proportion of Immigrants from Switzerland and poverty level among single males in the United States with a correlation coefficient (R) of 0.816 and weighted average of 12.8%. Similarly, the statistical analysis conducted on geographies consisting of 108,151,039 people shows a substantial positive correlation between the proportion of Bahamians and poverty level among single males in the United States with a correlation coefficient (R) of 0.582 and weighted average of 14.6%, a difference of 13.3%.
Single Male Poverty Correlation Summary
| Measurement | Immigrants from Switzerland | Bahamian |
| Minimum | 7.2% | 4.8% |
| Maximum | 100.0% | 41.8% |
| Range | 92.8% | 37.0% |
| Mean | 42.0% | 15.9% |
| Median | 33.6% | 14.8% |
| Interquartile 25% (IQ1) | 12.9% | 11.7% |
| Interquartile 75% (IQ3) | 58.9% | 19.6% |
| Interquartile Range (IQR) | 46.0% | 7.9% |
| Standard Deviation (Sample) | 32.4% | 7.4% |
| Standard Deviation (Population) | 31.3% | 7.4% |
Similar Demographics by Single Male Poverty
Demographics Similar to Immigrants from Switzerland by Single Male Poverty
In terms of single male poverty, the demographic groups most similar to Immigrants from Switzerland are Immigrants from Canada (12.8%, a difference of 0.090%), Israeli (12.9%, a difference of 0.11%), Syrian (12.8%, a difference of 0.28%), Immigrants from North America (12.9%, a difference of 0.29%), and Panamanian (12.9%, a difference of 0.30%).
| Demographics | Rating | Rank | Single Male Poverty |
| South Africans | 51.5 /100 | #171 | Average 12.8% |
| Danes | 51.4 /100 | #172 | Average 12.8% |
| Immigrants | St. Vincent and the Grenadines | 50.9 /100 | #173 | Average 12.8% |
| Costa Ricans | 50.0 /100 | #174 | Average 12.8% |
| Croatians | 48.9 /100 | #175 | Average 12.8% |
| Syrians | 48.4 /100 | #176 | Average 12.8% |
| Immigrants | Canada | 44.8 /100 | #177 | Average 12.8% |
| Immigrants | Switzerland | 43.1 /100 | #178 | Average 12.8% |
| Israelis | 41.0 /100 | #179 | Average 12.9% |
| Immigrants | North America | 37.7 /100 | #180 | Fair 12.9% |
| Panamanians | 37.6 /100 | #181 | Fair 12.9% |
| Moroccans | 36.8 /100 | #182 | Fair 12.9% |
| Immigrants | West Indies | 33.0 /100 | #183 | Fair 12.9% |
| Immigrants | Trinidad and Tobago | 32.5 /100 | #184 | Fair 12.9% |
| Norwegians | 32.0 /100 | #185 | Fair 12.9% |
Demographics Similar to Bahamians by Single Male Poverty
In terms of single male poverty, the demographic groups most similar to Bahamians are Nonimmigrants (14.6%, a difference of 0.13%), U.S. Virgin Islander (14.5%, a difference of 0.15%), French Canadian (14.6%, a difference of 0.25%), Immigrants from Dominica (14.5%, a difference of 0.38%), and Ottawa (14.6%, a difference of 0.43%).
| Demographics | Rating | Rank | Single Male Poverty |
| Immigrants | Bahamas | 0.0 /100 | #284 | Tragic 14.4% |
| French | 0.0 /100 | #285 | Tragic 14.4% |
| Celtics | 0.0 /100 | #286 | Tragic 14.5% |
| Iroquois | 0.0 /100 | #287 | Tragic 14.5% |
| Whites/Caucasians | 0.0 /100 | #288 | Tragic 14.5% |
| Immigrants | Dominica | 0.0 /100 | #289 | Tragic 14.5% |
| U.S. Virgin Islanders | 0.0 /100 | #290 | Tragic 14.5% |
| Bahamians | 0.0 /100 | #291 | Tragic 14.6% |
| Immigrants | Nonimmigrants | 0.0 /100 | #292 | Tragic 14.6% |
| French Canadians | 0.0 /100 | #293 | Tragic 14.6% |
| Ottawa | 0.0 /100 | #294 | Tragic 14.6% |
| Scotch-Irish | 0.0 /100 | #295 | Tragic 14.7% |
| Africans | 0.0 /100 | #296 | Tragic 14.7% |
| Immigrants | Dominican Republic | 0.0 /100 | #297 | Tragic 14.8% |
| French American Indians | 0.0 /100 | #298 | Tragic 15.0% |