Haitian vs American Single Male Poverty
COMPARE
Haitian
American
Single Male Poverty
Single Male Poverty Comparison
Haitians
Americans
13.2%
SINGLE MALE POVERTY
7.0/ 100
METRIC RATING
227th/ 347
METRIC RANK
15.8%
SINGLE MALE POVERTY
0.0/ 100
METRIC RATING
309th/ 347
METRIC RANK
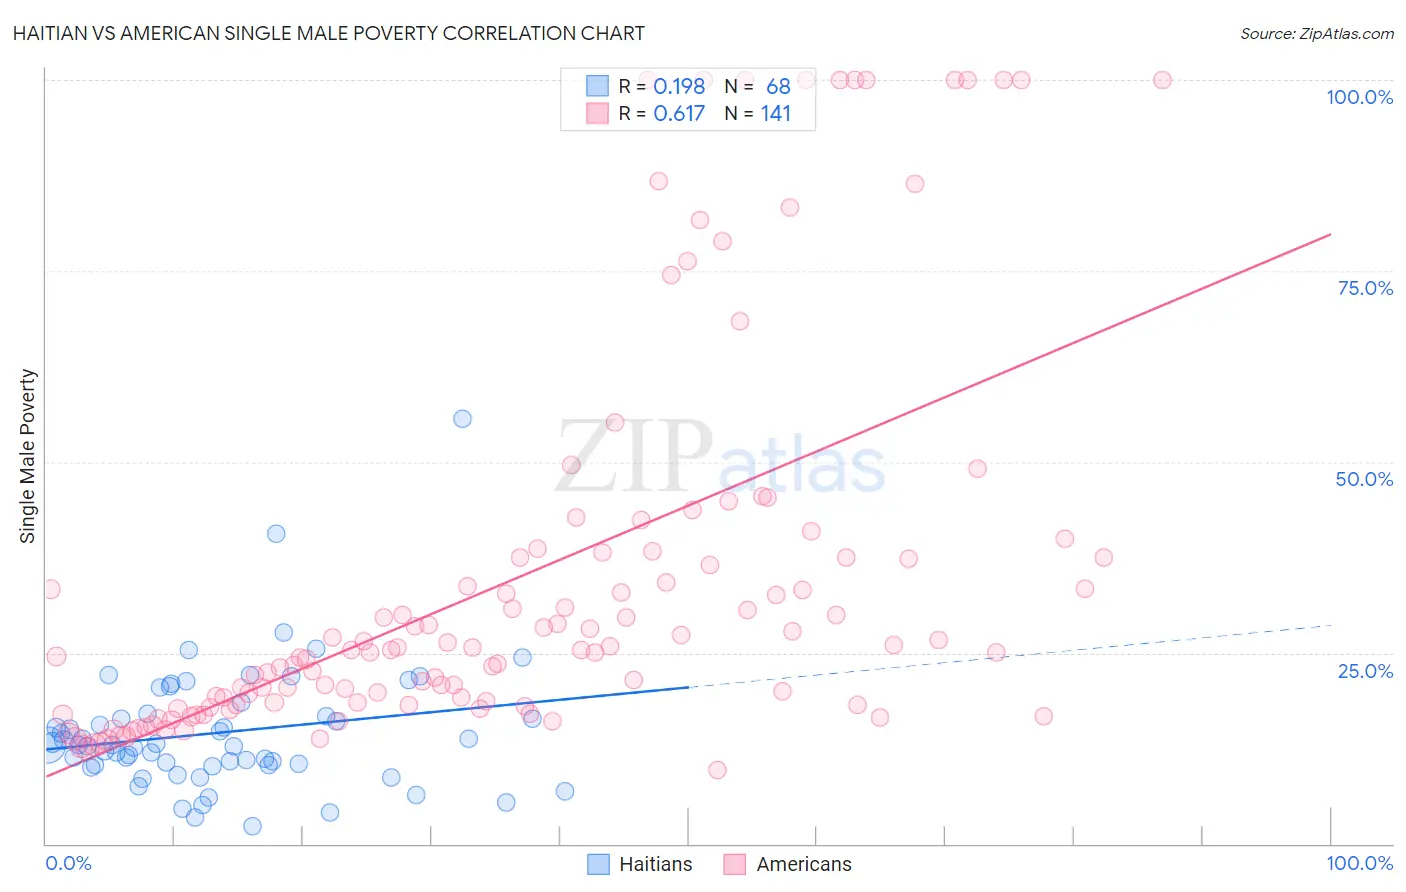
Haitian vs American Single Male Poverty Correlation Chart
The statistical analysis conducted on geographies consisting of 262,577,789 people shows a poor positive correlation between the proportion of Haitians and poverty level among single males in the United States with a correlation coefficient (R) of 0.198 and weighted average of 13.2%. Similarly, the statistical analysis conducted on geographies consisting of 478,139,646 people shows a significant positive correlation between the proportion of Americans and poverty level among single males in the United States with a correlation coefficient (R) of 0.617 and weighted average of 15.8%, a difference of 19.4%.
Single Male Poverty Correlation Summary
| Measurement | Haitian | American |
| Minimum | 2.3% | 9.7% |
| Maximum | 55.7% | 100.0% |
| Range | 53.4% | 90.3% |
| Mean | 14.5% | 34.5% |
| Median | 12.9% | 25.4% |
| Interquartile 25% (IQ1) | 10.3% | 18.2% |
| Interquartile 75% (IQ3) | 16.9% | 37.5% |
| Interquartile Range (IQR) | 6.6% | 19.3% |
| Standard Deviation (Sample) | 8.3% | 25.3% |
| Standard Deviation (Population) | 8.2% | 25.2% |
Similar Demographics by Single Male Poverty
Demographics Similar to Haitians by Single Male Poverty
In terms of single male poverty, the demographic groups most similar to Haitians are Lebanese (13.2%, a difference of 0.080%), Jamaican (13.2%, a difference of 0.13%), European (13.3%, a difference of 0.17%), Ghanaian (13.3%, a difference of 0.20%), and Immigrants from Denmark (13.2%, a difference of 0.30%).
| Demographics | Rating | Rank | Single Male Poverty |
| Central Americans | 10.9 /100 | #220 | Poor 13.2% |
| New Zealanders | 10.7 /100 | #221 | Poor 13.2% |
| Immigrants | Western Europe | 10.0 /100 | #222 | Poor 13.2% |
| Immigrants | Azores | 9.3 /100 | #223 | Tragic 13.2% |
| Somalis | 9.1 /100 | #224 | Tragic 13.2% |
| Immigrants | Denmark | 8.7 /100 | #225 | Tragic 13.2% |
| Jamaicans | 7.7 /100 | #226 | Tragic 13.2% |
| Haitians | 7.0 /100 | #227 | Tragic 13.2% |
| Lebanese | 6.6 /100 | #228 | Tragic 13.2% |
| Europeans | 6.2 /100 | #229 | Tragic 13.3% |
| Ghanaians | 6.1 /100 | #230 | Tragic 13.3% |
| Slavs | 5.3 /100 | #231 | Tragic 13.3% |
| Immigrants | Caribbean | 5.0 /100 | #232 | Tragic 13.3% |
| British | 4.0 /100 | #233 | Tragic 13.3% |
| Canadians | 4.0 /100 | #234 | Tragic 13.3% |
Demographics Similar to Americans by Single Male Poverty
In terms of single male poverty, the demographic groups most similar to Americans are Potawatomi (15.8%, a difference of 0.17%), Ute (15.7%, a difference of 0.73%), Yakama (15.9%, a difference of 0.87%), Seminole (16.0%, a difference of 1.4%), and Comanche (16.0%, a difference of 1.4%).
| Demographics | Rating | Rank | Single Male Poverty |
| Alsatians | 0.0 /100 | #302 | Tragic 15.2% |
| Aleuts | 0.0 /100 | #303 | Tragic 15.4% |
| Alaska Natives | 0.0 /100 | #304 | Tragic 15.4% |
| Blackfeet | 0.0 /100 | #305 | Tragic 15.5% |
| Pennsylvania Germans | 0.0 /100 | #306 | Tragic 15.6% |
| Ute | 0.0 /100 | #307 | Tragic 15.7% |
| Potawatomi | 0.0 /100 | #308 | Tragic 15.8% |
| Americans | 0.0 /100 | #309 | Tragic 15.8% |
| Yakama | 0.0 /100 | #310 | Tragic 15.9% |
| Seminole | 0.0 /100 | #311 | Tragic 16.0% |
| Comanche | 0.0 /100 | #312 | Tragic 16.0% |
| Cherokee | 0.0 /100 | #313 | Tragic 16.1% |
| Alaskan Athabascans | 0.0 /100 | #314 | Tragic 16.1% |
| Cheyenne | 0.0 /100 | #315 | Tragic 16.1% |
| Dutch West Indians | 0.0 /100 | #316 | Tragic 16.1% |