Immigrants vs Venezuelan Male Poverty
COMPARE
Immigrants
Venezuelan
Male Poverty
Male Poverty Comparison
Immigrants
Venezuelans
12.0%
MALE POVERTY
4.5/ 100
METRIC RATING
208th/ 347
METRIC RANK
11.0%
MALE POVERTY
67.4/ 100
METRIC RATING
151st/ 347
METRIC RANK
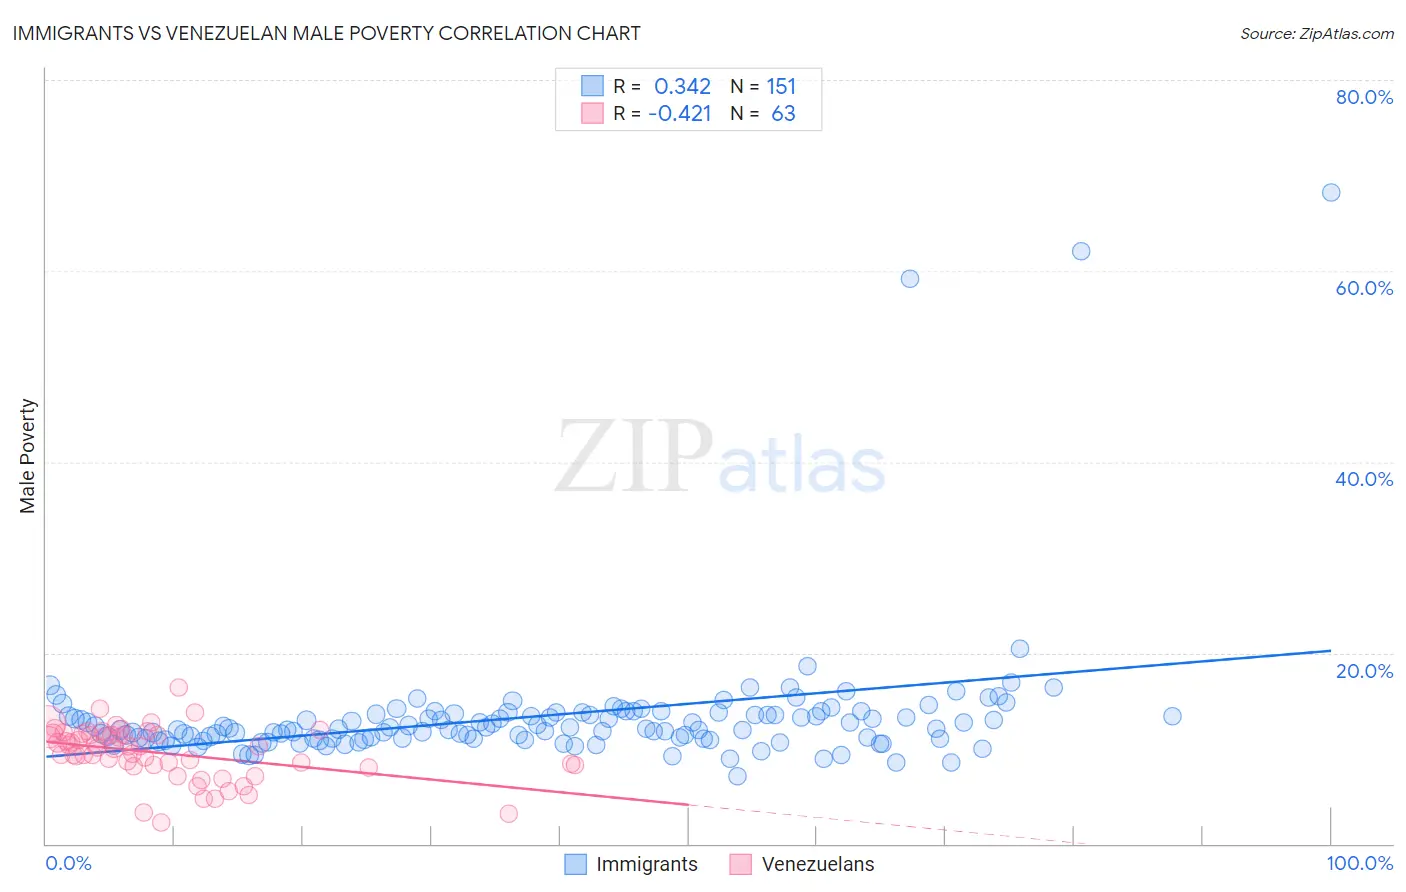
Immigrants vs Venezuelan Male Poverty Correlation Chart
The statistical analysis conducted on geographies consisting of 575,955,105 people shows a mild positive correlation between the proportion of Immigrants and poverty level among males in the United States with a correlation coefficient (R) of 0.342 and weighted average of 12.0%. Similarly, the statistical analysis conducted on geographies consisting of 305,957,955 people shows a moderate negative correlation between the proportion of Venezuelans and poverty level among males in the United States with a correlation coefficient (R) of -0.421 and weighted average of 11.0%, a difference of 9.4%.
Male Poverty Correlation Summary
| Measurement | Immigrants | Venezuelan |
| Minimum | 7.0% | 2.3% |
| Maximum | 68.2% | 16.3% |
| Range | 61.1% | 14.0% |
| Mean | 13.4% | 9.5% |
| Median | 12.0% | 10.1% |
| Interquartile 25% (IQ1) | 11.0% | 8.2% |
| Interquartile 75% (IQ3) | 13.6% | 11.5% |
| Interquartile Range (IQR) | 2.6% | 3.3% |
| Standard Deviation (Sample) | 7.4% | 2.8% |
| Standard Deviation (Population) | 7.4% | 2.7% |
Similar Demographics by Male Poverty
Demographics Similar to Immigrants by Male Poverty
In terms of male poverty, the demographic groups most similar to Immigrants are Immigrants from the Azores (12.0%, a difference of 0.12%), Moroccan (12.0%, a difference of 0.17%), Immigrants from Panama (12.1%, a difference of 0.29%), Malaysian (12.0%, a difference of 0.33%), and Immigrants from Eastern Africa (12.0%, a difference of 0.43%).
| Demographics | Rating | Rank | Male Poverty |
| Spaniards | 13.5 /100 | #201 | Poor 11.7% |
| Aleuts | 10.4 /100 | #202 | Poor 11.8% |
| Immigrants | Western Asia | 9.8 /100 | #203 | Tragic 11.8% |
| Immigrants | Uganda | 8.5 /100 | #204 | Tragic 11.8% |
| Panamanians | 6.2 /100 | #205 | Tragic 11.9% |
| Immigrants | Eastern Africa | 5.4 /100 | #206 | Tragic 12.0% |
| Malaysians | 5.2 /100 | #207 | Tragic 12.0% |
| Immigrants | Immigrants | 4.5 /100 | #208 | Tragic 12.0% |
| Immigrants | Azores | 4.3 /100 | #209 | Tragic 12.0% |
| Moroccans | 4.2 /100 | #210 | Tragic 12.0% |
| Immigrants | Panama | 4.0 /100 | #211 | Tragic 12.1% |
| Americans | 3.2 /100 | #212 | Tragic 12.1% |
| Immigrants | Nonimmigrants | 3.1 /100 | #213 | Tragic 12.1% |
| Japanese | 2.7 /100 | #214 | Tragic 12.2% |
| Immigrants | Uzbekistan | 2.6 /100 | #215 | Tragic 12.2% |
Demographics Similar to Venezuelans by Male Poverty
In terms of male poverty, the demographic groups most similar to Venezuelans are Immigrants from Nepal (11.0%, a difference of 0.0%), Guamanian/Chamorro (11.0%, a difference of 0.020%), Immigrants from Venezuela (11.0%, a difference of 0.060%), Armenian (11.0%, a difference of 0.080%), and Icelander (11.0%, a difference of 0.13%).
| Demographics | Rating | Rank | Male Poverty |
| Samoans | 71.8 /100 | #144 | Good 10.9% |
| Immigrants | Germany | 71.6 /100 | #145 | Good 10.9% |
| Syrians | 71.4 /100 | #146 | Good 10.9% |
| Icelanders | 68.5 /100 | #147 | Good 11.0% |
| Armenians | 68.0 /100 | #148 | Good 11.0% |
| Immigrants | Venezuela | 67.9 /100 | #149 | Good 11.0% |
| Guamanians/Chamorros | 67.6 /100 | #150 | Good 11.0% |
| Venezuelans | 67.4 /100 | #151 | Good 11.0% |
| Immigrants | Nepal | 67.3 /100 | #152 | Good 11.0% |
| Immigrants | Bosnia and Herzegovina | 65.2 /100 | #153 | Good 11.0% |
| Immigrants | Kazakhstan | 64.8 /100 | #154 | Good 11.0% |
| Immigrants | Malaysia | 64.7 /100 | #155 | Good 11.0% |
| Costa Ricans | 63.9 /100 | #156 | Good 11.0% |
| Scotch-Irish | 63.7 /100 | #157 | Good 11.0% |
| Colombians | 63.0 /100 | #158 | Good 11.0% |