Immigrants from Zimbabwe vs Slavic Male Poverty
COMPARE
Immigrants from Zimbabwe
Slavic
Male Poverty
Male Poverty Comparison
Immigrants from Zimbabwe
Slavs
10.5%
MALE POVERTY
92.0/ 100
METRIC RATING
101st/ 347
METRIC RANK
10.5%
MALE POVERTY
91.7/ 100
METRIC RATING
103rd/ 347
METRIC RANK
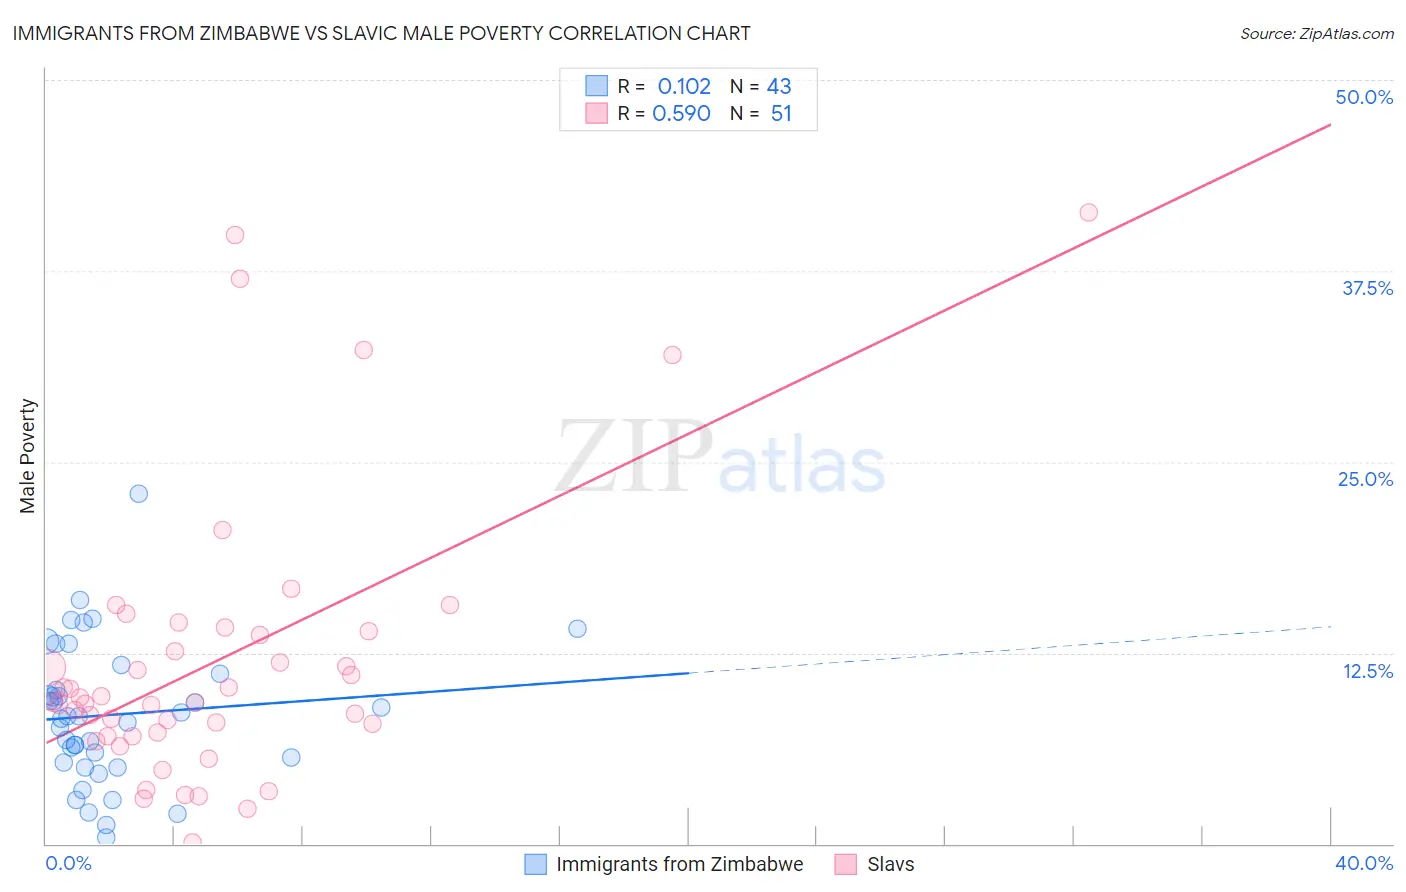
Immigrants from Zimbabwe vs Slavic Male Poverty Correlation Chart
The statistical analysis conducted on geographies consisting of 117,776,371 people shows a poor positive correlation between the proportion of Immigrants from Zimbabwe and poverty level among males in the United States with a correlation coefficient (R) of 0.102 and weighted average of 10.5%. Similarly, the statistical analysis conducted on geographies consisting of 270,742,219 people shows a substantial positive correlation between the proportion of Slavs and poverty level among males in the United States with a correlation coefficient (R) of 0.590 and weighted average of 10.5%, a difference of 0.11%.
Male Poverty Correlation Summary
| Measurement | Immigrants from Zimbabwe | Slavic |
| Minimum | 0.44% | 0.066% |
| Maximum | 23.0% | 41.3% |
| Range | 22.5% | 41.2% |
| Mean | 8.4% | 11.9% |
| Median | 8.3% | 9.3% |
| Interquartile 25% (IQ1) | 5.3% | 7.0% |
| Interquartile 75% (IQ3) | 11.2% | 13.9% |
| Interquartile Range (IQR) | 5.8% | 6.9% |
| Standard Deviation (Sample) | 4.6% | 9.2% |
| Standard Deviation (Population) | 4.5% | 9.1% |
Demographics Similar to Immigrants from Zimbabwe and Slavs by Male Poverty
In terms of male poverty, the demographic groups most similar to Immigrants from Zimbabwe are French Canadian (10.5%, a difference of 0.010%), Welsh (10.5%, a difference of 0.12%), Canadian (10.5%, a difference of 0.13%), Immigrants from Southern Europe (10.5%, a difference of 0.24%), and Laotian (10.5%, a difference of 0.25%). Similarly, the demographic groups most similar to Slavs are Welsh (10.5%, a difference of 0.010%), Canadian (10.5%, a difference of 0.020%), French Canadian (10.5%, a difference of 0.10%), Immigrants from Southern Europe (10.5%, a difference of 0.13%), and Laotian (10.5%, a difference of 0.14%).
| Demographics | Rating | Rank | Male Poverty |
| Jordanians | 94.4 /100 | #92 | Exceptional 10.4% |
| Australians | 94.4 /100 | #93 | Exceptional 10.4% |
| Immigrants | South Africa | 94.1 /100 | #94 | Exceptional 10.4% |
| Scottish | 94.0 /100 | #95 | Exceptional 10.4% |
| Immigrants | Egypt | 93.7 /100 | #96 | Exceptional 10.4% |
| Romanians | 93.6 /100 | #97 | Exceptional 10.5% |
| Finns | 93.4 /100 | #98 | Exceptional 10.5% |
| Immigrants | Indonesia | 93.3 /100 | #99 | Exceptional 10.5% |
| Immigrants | Latvia | 92.8 /100 | #100 | Exceptional 10.5% |
| Immigrants | Zimbabwe | 92.0 /100 | #101 | Exceptional 10.5% |
| French Canadians | 91.9 /100 | #102 | Exceptional 10.5% |
| Slavs | 91.7 /100 | #103 | Exceptional 10.5% |
| Welsh | 91.6 /100 | #104 | Exceptional 10.5% |
| Canadians | 91.6 /100 | #105 | Exceptional 10.5% |
| Immigrants | Southern Europe | 91.3 /100 | #106 | Exceptional 10.5% |
| Laotians | 91.2 /100 | #107 | Exceptional 10.5% |
| Portuguese | 91.0 /100 | #108 | Exceptional 10.6% |
| Albanians | 90.6 /100 | #109 | Exceptional 10.6% |
| Argentineans | 90.1 /100 | #110 | Exceptional 10.6% |
| Immigrants | Argentina | 89.8 /100 | #111 | Excellent 10.6% |
| Immigrants | Turkey | 89.5 /100 | #112 | Excellent 10.6% |